

Key Insights
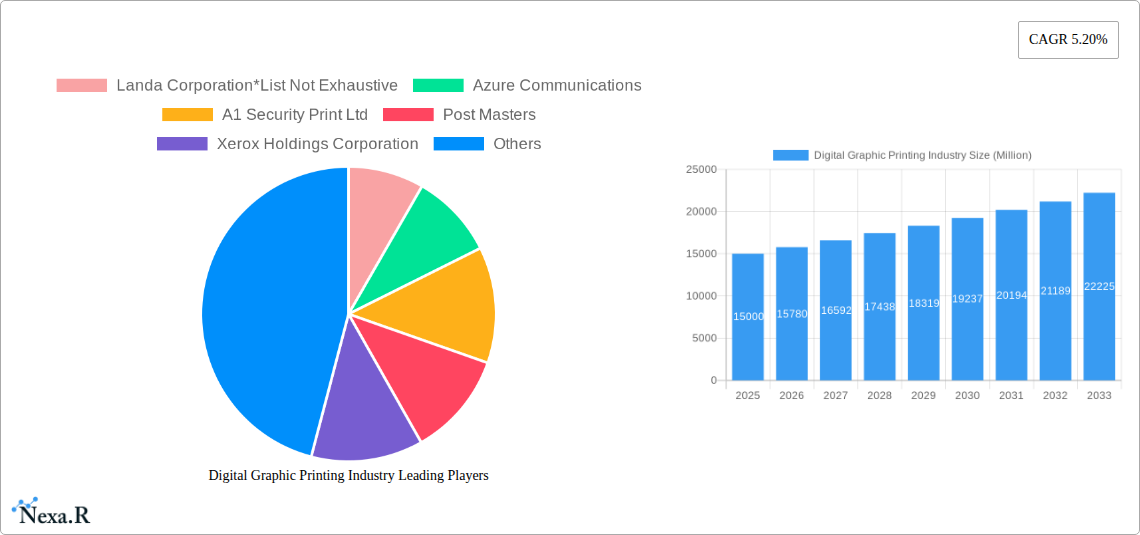
The digital graphic printing market, estimated at $14.9 billion in 2025, is projected for steady expansion with a CAGR of 1.7%. This growth is propelled by the escalating demand for personalized marketing collateral and packaging, alongside technological advancements in inkjet and electrophotography. Digital workflows are enhancing operational efficiency, reducing production timelines, and lowering costs, making them a compelling choice for businesses. The security printing sector is a key contributor, driven by the increasing need for counterfeit deterrence in pharmaceuticals and finance. Transactional printing also sustains demand through its integral role in core business operations. However, market growth faces headwinds from volatile raw material costs and robust competition. Inkjet printing leads in advertising and commercial printing, while electrophotography remains dominant in transactional and certain security applications. North America and Europe currently lead the market, with Asia-Pacific poised for significant growth fueled by economic development in China and India. The industry is also embracing sustainability, with a growing focus on eco-friendly inks and materials.
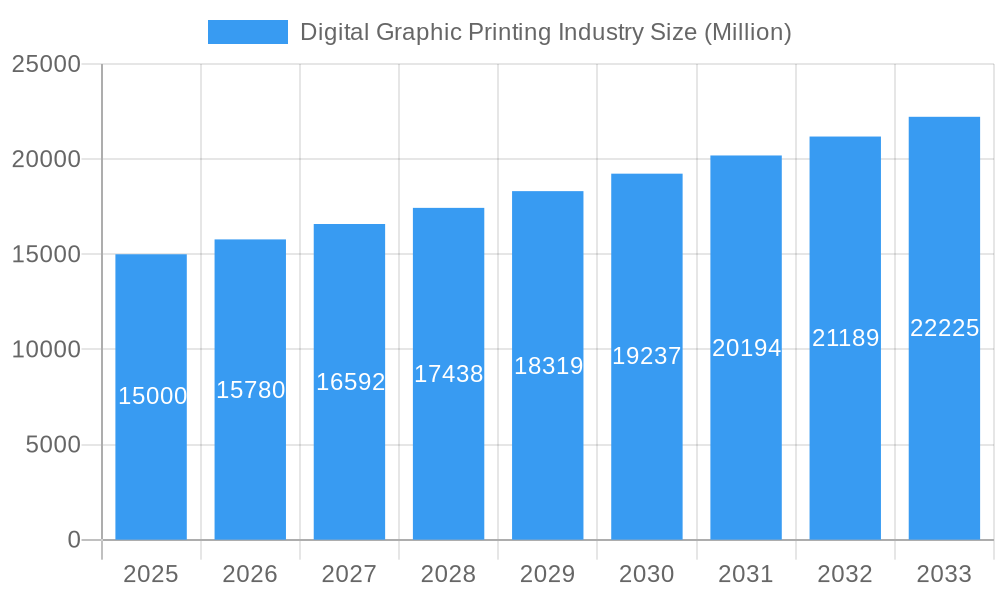
Digital Graphic Printing Industry Market Size (In Billion)
The competitive arena features a blend of global enterprises and regional specialists. Prominent players like Xerox Holdings Corporation, Giesecke+Devrient, and Landa Corporation are investing in R&D for innovative solutions and market expansion. Industry consolidation through mergers and acquisitions is expected to redefine competitive dynamics. The integration of cloud-based printing and advanced data analytics is reshaping business models and creating new avenues for growth. Future projections indicate continued market expansion, potentially at a moderated pace due to segment saturation. The trajectory of digital graphic printing is closely linked to technological innovation, evolving sustainability regulations, and broader economic trends.
Digital Graphic Printing Industry Company Market Share
Digital Graphic Printing Industry Market Report: 2019-2033
This comprehensive report provides an in-depth analysis of the Digital Graphic Printing Industry, encompassing market dynamics, growth trends, regional dominance, product landscape, key players, and future outlook. The study covers the period 2019-2033, with a focus on the base year 2025 and a forecast period of 2025-2033. The report segments the market by printing process (Inkjet, Electrophotography) and application (Advertising Print, Transactional Printing, Security Printing, General Commercial Print), offering granular insights into this dynamic sector. Market size is presented in million units.
Digital Graphic Printing Industry Market Dynamics & Structure
The digital graphic printing market is characterized by a moderately concentrated structure with a few major players holding significant market share. Technological innovation, particularly in inkjet and electrophotography, is a key driver, constantly pushing boundaries in print quality, speed, and cost-effectiveness. Stringent regulatory frameworks regarding ink composition and waste management influence industry practices. The market faces competition from digital alternatives like e-communication and the increasing prevalence of digital signage. End-user demographics are diverse, ranging from small businesses to large corporations across various sectors. M&A activity has been relatively moderate in recent years, with a predicted xx number of deals in 2025, signaling strategic consolidation within the industry.
- Market Concentration: Moderately concentrated, with top 5 players holding approximately xx% of market share in 2025.
- Technological Innovation: Continuous advancements in inkjet and electrophotography technologies, driving increased print speed and quality.
- Regulatory Framework: Stricter environmental regulations impacting ink formulations and waste disposal, creating cost pressures.
- Competitive Substitutes: Digital alternatives like email marketing and online advertising present competitive challenges.
- End-User Demographics: Diverse user base spanning small businesses to large corporations across various industries.
- M&A Trends: Approximately xx M&A deals predicted for 2025, indicating strategic consolidation.
Digital Graphic Printing Industry Growth Trends & Insights
The digital graphic printing market exhibited significant growth from 2019 to 2024, driven primarily by increasing demand across various applications. The market size reached xx million units in 2024 and is projected to grow at a Compound Annual Growth Rate (CAGR) of xx% from 2025 to 2033, reaching xx million units by 2033. This growth is fueled by several factors including the rising adoption of digital printing technologies across diverse sectors and continuous technological advancements leading to improved print quality and reduced costs. The increasing penetration of inkjet technology, particularly in high-volume applications like transactional printing, is a key factor contributing to the market expansion. Consumer behavior shifts towards personalized and on-demand printing further contribute to the growth. Technological disruptions, such as the introduction of high-speed, large-format inkjet printers, are further accelerating market expansion and market penetration.
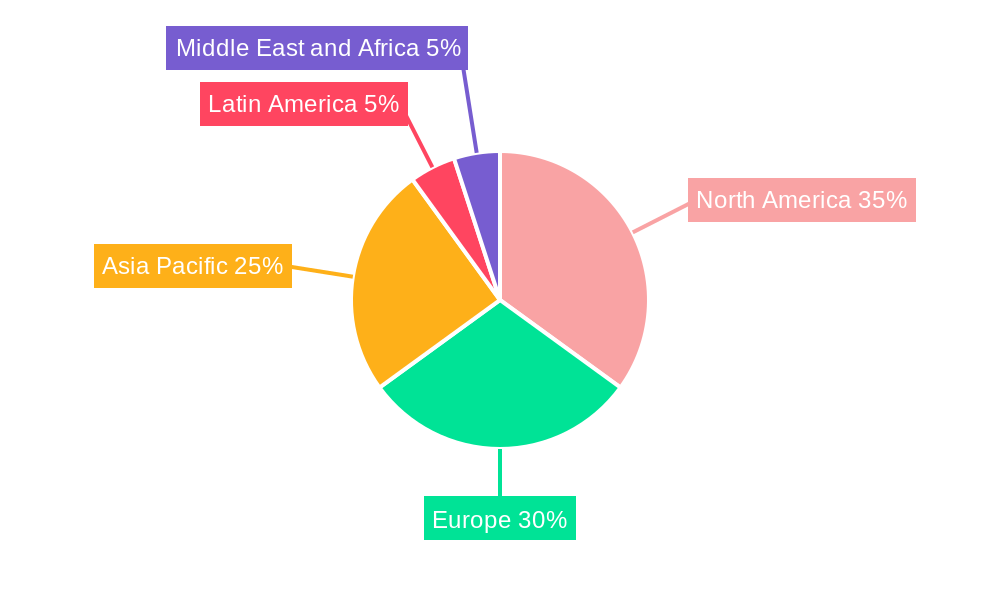
Dominant Regions, Countries, or Segments in Digital Graphic Printing Industry
North America currently holds the largest market share in the digital graphic printing industry, followed by Europe and Asia-Pacific. This dominance is attributed to factors like well-established infrastructure, high technological adoption rates, and a large number of printing businesses. Within the printing process segment, inkjet printing is experiencing the fastest growth, particularly in applications like advertising print and general commercial print, while electrophotography remains dominant in transactional printing and security printing.
- Key Drivers in North America: Robust economic conditions, advanced infrastructure, and high adoption of digital technologies.
- Key Drivers in Europe: Increasing demand for personalized marketing materials and high government spending on security printing.
- Key Drivers in Asia-Pacific: Rapid economic growth and rising disposable incomes, leading to increased demand for various print applications.
- Inkjet Printing Dominance: Driven by its ability to handle high volumes and offer high-quality color printing.
- Electrophotography Dominance: Remains strong in security and transactional printing due to its reliability and cost-effectiveness.
Digital Graphic Printing Industry Product Landscape
The digital graphic printing product landscape features continuous innovation in printing technologies, materials, and software. High-speed, high-resolution inkjet printers are gaining traction, offering significant improvements in print quality and speed. The integration of automation and data analytics in printing processes enhances efficiency and reduces operational costs. Key product advancements focus on achieving greater color accuracy, reducing ink consumption, and expanding application versatility. Unique selling propositions include streamlined workflows, cost-effectiveness, and environmentally friendly inks.
Key Drivers, Barriers & Challenges in Digital Graphic Printing Industry
Key Drivers: Rising demand for personalized marketing materials, increased adoption of digital printing technologies across sectors, advancements in inkjet technology offering high-quality and cost-effective printing, and increasing government spending on security printing.
Challenges: High initial investment costs for advanced printing equipment, stringent environmental regulations regarding ink composition and waste disposal, intense competition from established and emerging players, and supply chain disruptions affecting the availability of raw materials and components. These challenges are estimated to impact market growth by approximately xx% in the forecast period.
Emerging Opportunities in Digital Graphic Printing Industry
Emerging opportunities lie in the growth of on-demand printing services, increasing demand for personalized packaging and labels, expanding applications in 3D printing, and the development of eco-friendly inks and printing processes. Untapped markets in developing economies offer significant potential.
Growth Accelerators in the Digital Graphic Printing Industry
Technological advancements, particularly in inkjet and electrophotography, are major growth accelerators. Strategic partnerships between printing equipment manufacturers and software providers are streamlining workflows and boosting productivity. Market expansion into new geographic regions and vertical markets is further driving growth.
Key Players Shaping the Digital Graphic Printing Industry Market
- Landa Corporation
- Azure Communications
- A1 Security Print Ltd
- Post Masters
- Xerox Holdings Corporation
- Giesecke+Devrient Currency Technology GmbH
- Madras Security Printers Pvt Ltd
- Swiss Post Solutions
Notable Milestones in Digital Graphic Printing Industry Sector
- 2021: Landa Corporation launches a new generation of Nanographic Printing Presses.
- 2022: Xerox introduces a high-speed inkjet printer for commercial applications.
- 2023: Significant advancements in eco-friendly ink formulations by multiple industry players.
In-Depth Digital Graphic Printing Industry Market Outlook
The digital graphic printing market is poised for sustained growth driven by technological advancements and increasing demand across various applications. The forecast period will likely witness further consolidation through mergers and acquisitions, as companies strive for economies of scale and technological leadership. The expansion into new markets and the adoption of innovative business models, such as print-on-demand services, will continue to shape the industry's future. The market is expected to reach xx million units by 2033, representing significant growth potential for industry participants.
Digital Graphic Printing Industry Segmentation
-
1. Printing Process
- 1.1. Inkjet
- 1.2. Electrophotography
-
2. Application
- 2.1. Advertising Print
- 2.2. Transactional Printing
- 2.3. Security Printing
- 2.4. General Commercial Print
Digital Graphic Printing Industry Segmentation By Geography
-
1. North America
- 1.1. United States
- 1.2. Canada
-
2. Europe
- 2.1. United kingdom
- 2.2. Germany
- 2.3. France
- 2.4. Spain
- 2.5. Italy
- 2.6. Poland
- 2.7. Netherlands
- 2.8. Rest of Europe
-
3. Asia Pacific
- 3.1. China
- 3.2. India
- 3.3. Japan
- 3.4. Rest of Asia Pacific
- 4. Latin America
- 5. Middle East and Africa
Digital Graphic Printing Industry Regional Market Share
Geographic Coverage of Digital Graphic Printing Industry
Digital Graphic Printing Industry REPORT HIGHLIGHTS
| Aspects | Details |
|---|---|
| Study Period | 2020-2034 |
| Base Year | 2025 |
| Estimated Year | 2026 |
| Forecast Period | 2026-2034 |
| Historical Period | 2020-2025 |
| Growth Rate | CAGR of 1.7% from 2020-2034 |
| Segmentation |
|
Table of Contents
- 1. Introduction
- 1.1. Research Scope
- 1.2. Market Segmentation
- 1.3. Research Objective
- 1.4. Definitions and Assumptions
- 2. Executive Summary
- 2.1. Market Snapshot
- 3. Market Dynamics
- 3.1. Market Drivers
- 3.2. Market Restrains
- 3.3. Market Trends
- 3.4. Market Opportunities
- 4. Market Factor Analysis
- 4.1. Porters Five Forces
- 4.1.1. Bargaining Power of Suppliers
- 4.1.2. Bargaining Power of Buyers
- 4.1.3. Threat of New Entrants
- 4.1.4. Threat of Substitutes
- 4.1.5. Competitive Rivalry
- 4.2. PESTEL analysis
- 4.3. BCG Analysis
- 4.3.1. Stars (High Growth, High Market Share)
- 4.3.2. Cash Cows (Low Growth, High Market Share)
- 4.3.3. Question Mark (High Growth, Low Market Share)
- 4.3.4. Dogs (Low Growth, Low Market Share)
- 4.4. Ansoff Matrix Analysis
- 4.5. Supply Chain Analysis
- 4.6. Regulatory Landscape
- 4.7. Current Market Potential and Opportunity Assessment (TAM–SAM–SOM Framework)
- 4.8. NRP Analyst Note
- 4.1. Porters Five Forces
- 5. Market Analysis, Insights and Forecast 2021-2033
- 5.1. Market Analysis, Insights and Forecast - by Printing Process
- 5.1.1. Inkjet
- 5.1.2. Electrophotography
- 5.2. Market Analysis, Insights and Forecast - by Application
- 5.2.1. Advertising Print
- 5.2.2. Transactional Printing
- 5.2.3. Security Printing
- 5.2.4. General Commercial Print
- 5.3. Market Analysis, Insights and Forecast - by Region
- 5.3.1. North America
- 5.3.2. Europe
- 5.3.3. Asia Pacific
- 5.3.4. Latin America
- 5.3.5. Middle East and Africa
- 5.1. Market Analysis, Insights and Forecast - by Printing Process
- 6. Global Digital Graphic Printing Industry Analysis, Insights and Forecast, 2021-2033
- 6.1. Market Analysis, Insights and Forecast - by Printing Process
- 6.1.1. Inkjet
- 6.1.2. Electrophotography
- 6.2. Market Analysis, Insights and Forecast - by Application
- 6.2.1. Advertising Print
- 6.2.2. Transactional Printing
- 6.2.3. Security Printing
- 6.2.4. General Commercial Print
- 6.1. Market Analysis, Insights and Forecast - by Printing Process
- 7. North America Digital Graphic Printing Industry Analysis, Insights and Forecast, 2020-2032
- 7.1. Market Analysis, Insights and Forecast - by Printing Process
- 7.1.1. Inkjet
- 7.1.2. Electrophotography
- 7.2. Market Analysis, Insights and Forecast - by Application
- 7.2.1. Advertising Print
- 7.2.2. Transactional Printing
- 7.2.3. Security Printing
- 7.2.4. General Commercial Print
- 7.1. Market Analysis, Insights and Forecast - by Printing Process
- 8. Europe Digital Graphic Printing Industry Analysis, Insights and Forecast, 2020-2032
- 8.1. Market Analysis, Insights and Forecast - by Printing Process
- 8.1.1. Inkjet
- 8.1.2. Electrophotography
- 8.2. Market Analysis, Insights and Forecast - by Application
- 8.2.1. Advertising Print
- 8.2.2. Transactional Printing
- 8.2.3. Security Printing
- 8.2.4. General Commercial Print
- 8.1. Market Analysis, Insights and Forecast - by Printing Process
- 9. Asia Pacific Digital Graphic Printing Industry Analysis, Insights and Forecast, 2020-2032
- 9.1. Market Analysis, Insights and Forecast - by Printing Process
- 9.1.1. Inkjet
- 9.1.2. Electrophotography
- 9.2. Market Analysis, Insights and Forecast - by Application
- 9.2.1. Advertising Print
- 9.2.2. Transactional Printing
- 9.2.3. Security Printing
- 9.2.4. General Commercial Print
- 9.1. Market Analysis, Insights and Forecast - by Printing Process
- 10. Latin America Digital Graphic Printing Industry Analysis, Insights and Forecast, 2020-2032
- 10.1. Market Analysis, Insights and Forecast - by Printing Process
- 10.1.1. Inkjet
- 10.1.2. Electrophotography
- 10.2. Market Analysis, Insights and Forecast - by Application
- 10.2.1. Advertising Print
- 10.2.2. Transactional Printing
- 10.2.3. Security Printing
- 10.2.4. General Commercial Print
- 10.1. Market Analysis, Insights and Forecast - by Printing Process
- 11. Middle East and Africa Digital Graphic Printing Industry Analysis, Insights and Forecast, 2020-2032
- 11.1. Market Analysis, Insights and Forecast - by Printing Process
- 11.1.1. Inkjet
- 11.1.2. Electrophotography
- 11.2. Market Analysis, Insights and Forecast - by Application
- 11.2.1. Advertising Print
- 11.2.2. Transactional Printing
- 11.2.3. Security Printing
- 11.2.4. General Commercial Print
- 11.1. Market Analysis, Insights and Forecast - by Printing Process
- 12. Competitive Analysis
- 12.1. Company Profiles
- 12.1.1 Landa Corporation*List Not Exhaustive
- 12.1.1.1. Company Overview
- 12.1.1.2. Products
- 12.1.1.3. Company Financials
- 12.1.1.4. SWOT Analysis
- 12.1.2 Azure Communications
- 12.1.2.1. Company Overview
- 12.1.2.2. Products
- 12.1.2.3. Company Financials
- 12.1.2.4. SWOT Analysis
- 12.1.3 A1 Security Print Ltd
- 12.1.3.1. Company Overview
- 12.1.3.2. Products
- 12.1.3.3. Company Financials
- 12.1.3.4. SWOT Analysis
- 12.1.4 Post Masters
- 12.1.4.1. Company Overview
- 12.1.4.2. Products
- 12.1.4.3. Company Financials
- 12.1.4.4. SWOT Analysis
- 12.1.5 Xerox Holdings Corporation
- 12.1.5.1. Company Overview
- 12.1.5.2. Products
- 12.1.5.3. Company Financials
- 12.1.5.4. SWOT Analysis
- 12.1.6 Giesecke+Devrient Currency Technology GmbH
- 12.1.6.1. Company Overview
- 12.1.6.2. Products
- 12.1.6.3. Company Financials
- 12.1.6.4. SWOT Analysis
- 12.1.7 Madras Security Printers Pvt Ltd
- 12.1.7.1. Company Overview
- 12.1.7.2. Products
- 12.1.7.3. Company Financials
- 12.1.7.4. SWOT Analysis
- 12.1.8 Swiss Post Solutions
- 12.1.8.1. Company Overview
- 12.1.8.2. Products
- 12.1.8.3. Company Financials
- 12.1.8.4. SWOT Analysis
- 12.1.1 Landa Corporation*List Not Exhaustive
- 12.2. Market Entropy
- 12.2.1 Company's Key Areas Served
- 12.2.2 Recent Developments
- 12.3. Company Market Share Analysis 2025
- 12.3.1 Top 5 Companies Market Share Analysis
- 12.3.2 Top 3 Companies Market Share Analysis
- 12.4. List of Potential Customers
- 13. Research Methodology
List of Figures
- Figure 1: Global Digital Graphic Printing Industry Revenue Breakdown (billion, %) by Region 2025 & 2033
- Figure 2: North America Digital Graphic Printing Industry Revenue (billion), by Printing Process 2025 & 2033
- Figure 3: North America Digital Graphic Printing Industry Revenue Share (%), by Printing Process 2025 & 2033
- Figure 4: North America Digital Graphic Printing Industry Revenue (billion), by Application 2025 & 2033
- Figure 5: North America Digital Graphic Printing Industry Revenue Share (%), by Application 2025 & 2033
- Figure 6: North America Digital Graphic Printing Industry Revenue (billion), by Country 2025 & 2033
- Figure 7: North America Digital Graphic Printing Industry Revenue Share (%), by Country 2025 & 2033
- Figure 8: Europe Digital Graphic Printing Industry Revenue (billion), by Printing Process 2025 & 2033
- Figure 9: Europe Digital Graphic Printing Industry Revenue Share (%), by Printing Process 2025 & 2033
- Figure 10: Europe Digital Graphic Printing Industry Revenue (billion), by Application 2025 & 2033
- Figure 11: Europe Digital Graphic Printing Industry Revenue Share (%), by Application 2025 & 2033
- Figure 12: Europe Digital Graphic Printing Industry Revenue (billion), by Country 2025 & 2033
- Figure 13: Europe Digital Graphic Printing Industry Revenue Share (%), by Country 2025 & 2033
- Figure 14: Asia Pacific Digital Graphic Printing Industry Revenue (billion), by Printing Process 2025 & 2033
- Figure 15: Asia Pacific Digital Graphic Printing Industry Revenue Share (%), by Printing Process 2025 & 2033
- Figure 16: Asia Pacific Digital Graphic Printing Industry Revenue (billion), by Application 2025 & 2033
- Figure 17: Asia Pacific Digital Graphic Printing Industry Revenue Share (%), by Application 2025 & 2033
- Figure 18: Asia Pacific Digital Graphic Printing Industry Revenue (billion), by Country 2025 & 2033
- Figure 19: Asia Pacific Digital Graphic Printing Industry Revenue Share (%), by Country 2025 & 2033
- Figure 20: Latin America Digital Graphic Printing Industry Revenue (billion), by Printing Process 2025 & 2033
- Figure 21: Latin America Digital Graphic Printing Industry Revenue Share (%), by Printing Process 2025 & 2033
- Figure 22: Latin America Digital Graphic Printing Industry Revenue (billion), by Application 2025 & 2033
- Figure 23: Latin America Digital Graphic Printing Industry Revenue Share (%), by Application 2025 & 2033
- Figure 24: Latin America Digital Graphic Printing Industry Revenue (billion), by Country 2025 & 2033
- Figure 25: Latin America Digital Graphic Printing Industry Revenue Share (%), by Country 2025 & 2033
- Figure 26: Middle East and Africa Digital Graphic Printing Industry Revenue (billion), by Printing Process 2025 & 2033
- Figure 27: Middle East and Africa Digital Graphic Printing Industry Revenue Share (%), by Printing Process 2025 & 2033
- Figure 28: Middle East and Africa Digital Graphic Printing Industry Revenue (billion), by Application 2025 & 2033
- Figure 29: Middle East and Africa Digital Graphic Printing Industry Revenue Share (%), by Application 2025 & 2033
- Figure 30: Middle East and Africa Digital Graphic Printing Industry Revenue (billion), by Country 2025 & 2033
- Figure 31: Middle East and Africa Digital Graphic Printing Industry Revenue Share (%), by Country 2025 & 2033
List of Tables
- Table 1: Global Digital Graphic Printing Industry Revenue billion Forecast, by Printing Process 2020 & 2033
- Table 2: Global Digital Graphic Printing Industry Revenue billion Forecast, by Application 2020 & 2033
- Table 3: Global Digital Graphic Printing Industry Revenue billion Forecast, by Region 2020 & 2033
- Table 4: Global Digital Graphic Printing Industry Revenue billion Forecast, by Printing Process 2020 & 2033
- Table 5: Global Digital Graphic Printing Industry Revenue billion Forecast, by Application 2020 & 2033
- Table 6: Global Digital Graphic Printing Industry Revenue billion Forecast, by Country 2020 & 2033
- Table 7: United States Digital Graphic Printing Industry Revenue (billion) Forecast, by Application 2020 & 2033
- Table 8: Canada Digital Graphic Printing Industry Revenue (billion) Forecast, by Application 2020 & 2033
- Table 9: Global Digital Graphic Printing Industry Revenue billion Forecast, by Printing Process 2020 & 2033
- Table 10: Global Digital Graphic Printing Industry Revenue billion Forecast, by Application 2020 & 2033
- Table 11: Global Digital Graphic Printing Industry Revenue billion Forecast, by Country 2020 & 2033
- Table 12: United kingdom Digital Graphic Printing Industry Revenue (billion) Forecast, by Application 2020 & 2033
- Table 13: Germany Digital Graphic Printing Industry Revenue (billion) Forecast, by Application 2020 & 2033
- Table 14: France Digital Graphic Printing Industry Revenue (billion) Forecast, by Application 2020 & 2033
- Table 15: Spain Digital Graphic Printing Industry Revenue (billion) Forecast, by Application 2020 & 2033
- Table 16: Italy Digital Graphic Printing Industry Revenue (billion) Forecast, by Application 2020 & 2033
- Table 17: Poland Digital Graphic Printing Industry Revenue (billion) Forecast, by Application 2020 & 2033
- Table 18: Netherlands Digital Graphic Printing Industry Revenue (billion) Forecast, by Application 2020 & 2033
- Table 19: Rest of Europe Digital Graphic Printing Industry Revenue (billion) Forecast, by Application 2020 & 2033
- Table 20: Global Digital Graphic Printing Industry Revenue billion Forecast, by Printing Process 2020 & 2033
- Table 21: Global Digital Graphic Printing Industry Revenue billion Forecast, by Application 2020 & 2033
- Table 22: Global Digital Graphic Printing Industry Revenue billion Forecast, by Country 2020 & 2033
- Table 23: China Digital Graphic Printing Industry Revenue (billion) Forecast, by Application 2020 & 2033
- Table 24: India Digital Graphic Printing Industry Revenue (billion) Forecast, by Application 2020 & 2033
- Table 25: Japan Digital Graphic Printing Industry Revenue (billion) Forecast, by Application 2020 & 2033
- Table 26: Rest of Asia Pacific Digital Graphic Printing Industry Revenue (billion) Forecast, by Application 2020 & 2033
- Table 27: Global Digital Graphic Printing Industry Revenue billion Forecast, by Printing Process 2020 & 2033
- Table 28: Global Digital Graphic Printing Industry Revenue billion Forecast, by Application 2020 & 2033
- Table 29: Global Digital Graphic Printing Industry Revenue billion Forecast, by Country 2020 & 2033
- Table 30: Global Digital Graphic Printing Industry Revenue billion Forecast, by Printing Process 2020 & 2033
- Table 31: Global Digital Graphic Printing Industry Revenue billion Forecast, by Application 2020 & 2033
- Table 32: Global Digital Graphic Printing Industry Revenue billion Forecast, by Country 2020 & 2033
Frequently Asked Questions
1. What is the projected Compound Annual Growth Rate (CAGR) of the Digital Graphic Printing Industry?
The projected CAGR is approximately 1.7%.
2. Which companies are prominent players in the Digital Graphic Printing Industry?
Key companies in the market include Landa Corporation*List Not Exhaustive, Azure Communications, A1 Security Print Ltd, Post Masters, Xerox Holdings Corporation, Giesecke+Devrient Currency Technology GmbH, Madras Security Printers Pvt Ltd, Swiss Post Solutions.
3. What are the main segments of the Digital Graphic Printing Industry?
The market segments include Printing Process, Application.
4. Can you provide details about the market size?
The market size is estimated to be USD 14.9 billion as of 2022.
5. What are some drivers contributing to market growth?
Glass containers for food and beverages are 100% recyclable and hence can be recycled endlessly without loss in quality or purity - something few food and beverage packaging options can claim. Manufacturers benefit from recycling in several ways: Recycled glass reduces emissions and consumption of raw materials. extends the life of plant equipment. such as furnaces. and saves energy.; The growth in population in the country in the recent years has led to a rise in the building & construction sector where soda-lime-silica-based glass is used in windowpanes. owing to their hardness and ease of workability..
6. What are the notable trends driving market growth?
Inkjet Printing Process is Expected to Hold a Significant Share in the Market Over the Forecast Period.
7. Are there any restraints impacting market growth?
However. container glass is manufactured by a process called annealing in which different air polluting compounds such as nitrogen oxides. sulfur dioxides. and other harmful particulates are released. Exposure to these harmful compounds at high concentrations can cause severe respiratory diseases such as asthma. chronic bronchitis. mucus secretion. and lung cancer..
8. Can you provide examples of recent developments in the market?
N/A
9. What pricing options are available for accessing the report?
Pricing options include single-user, multi-user, and enterprise licenses priced at USD 4750, USD 5250, and USD 8750 respectively.
10. Is the market size provided in terms of value or volume?
The market size is provided in terms of value, measured in billion.
11. Are there any specific market keywords associated with the report?
Yes, the market keyword associated with the report is "Digital Graphic Printing Industry," which aids in identifying and referencing the specific market segment covered.
12. How do I determine which pricing option suits my needs best?
The pricing options vary based on user requirements and access needs. Individual users may opt for single-user licenses, while businesses requiring broader access may choose multi-user or enterprise licenses for cost-effective access to the report.
13. Are there any additional resources or data provided in the Digital Graphic Printing Industry report?
While the report offers comprehensive insights, it's advisable to review the specific contents or supplementary materials provided to ascertain if additional resources or data are available.
14. How can I stay updated on further developments or reports in the Digital Graphic Printing Industry?
To stay informed about further developments, trends, and reports in the Digital Graphic Printing Industry, consider subscribing to industry newsletters, following relevant companies and organizations, or regularly checking reputable industry news sources and publications.
Methodology
Step 1 - Identification of Relevant Samples Size from Population Database


Step 2 - Approaches for Defining Global Market Size (Value, Volume* & Price*)

Note*: In applicable scenarios
Step 3 - Data Sources
Primary Research
- Web Analytics
- Survey Reports
- Research Institute
- Latest Research Reports
- Opinion Leaders
Secondary Research
- Annual Reports
- White Paper
- Latest Press Release
- Industry Association
- Paid Database
- Investor Presentations

Step 4 - Data Triangulation
Involves using different sources of information in order to increase the validity of a study
These sources are likely to be stakeholders in a program - participants, other researchers, program staff, other community members, and so on.
Then we put all data in single framework & apply various statistical tools to find out the dynamic on the market.
During the analysis stage, feedback from the stakeholder groups would be compared to determine areas of agreement as well as areas of divergence