
Key Insights
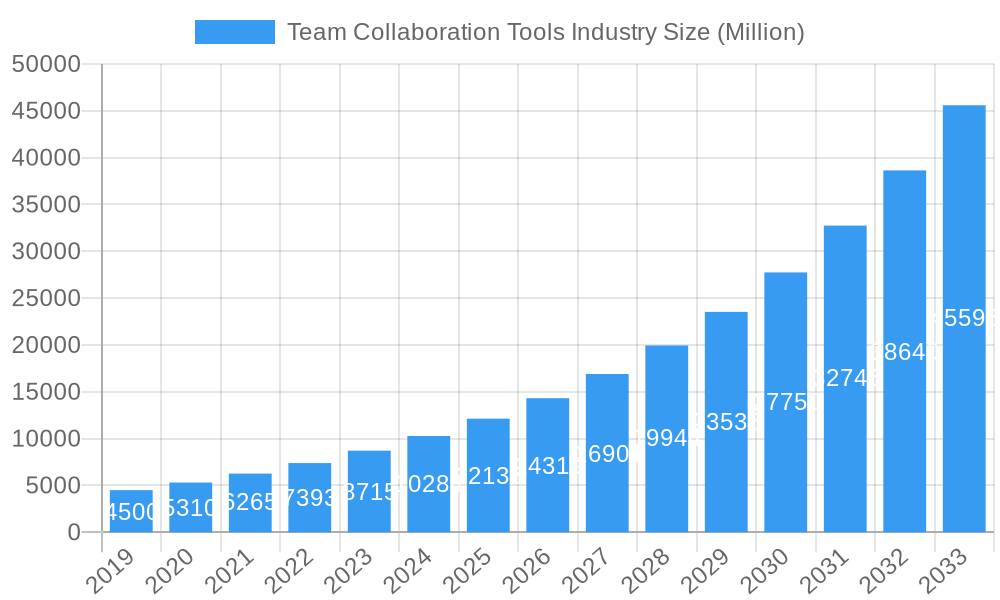
The global Team Collaboration Tools market is poised for exceptional growth, projected to reach an estimated $13,500 Million in 2025 with a remarkable Compound Annual Growth Rate (CAGR) of 18.00% through 2033. This rapid expansion is primarily fueled by the increasing adoption of remote and hybrid work models, which have underscored the indispensable nature of digital collaboration solutions for maintaining productivity and fostering team cohesion. The surge in demand is further propelled by the growing need for streamlined communication, efficient project management, and enhanced document sharing across geographically dispersed teams. Organizations of all sizes, from agile small and medium enterprises (SMEs) to large corporations, are actively investing in these tools to optimize workflows, reduce operational inefficiencies, and empower their workforces. Key drivers include the continuous innovation in features such as AI-powered task management, advanced video conferencing capabilities, and robust integration with other business applications, all contributing to a more connected and productive work environment.
Team Collaboration Tools Industry Market Size (In Billion)
The market is witnessing significant trends driven by technological advancements and evolving workplace dynamics. The shift towards cloud-based deployment models continues to dominate, offering scalability, flexibility, and cost-effectiveness, which are particularly attractive to SMEs. However, on-premise solutions remain relevant for organizations with stringent data security and compliance requirements. Geographically, North America is expected to lead the market due to its early adoption of technology and the prevalent remote work culture, followed closely by Europe and the rapidly developing Asia Pacific region, where digital transformation initiatives are gaining significant momentum. Restraints such as data security concerns and the initial investment cost for comprehensive solutions are being addressed through enhanced security features and the growing availability of tiered pricing models. The competitive landscape is characterized by the presence of established players and emerging innovators, all striving to capture market share through feature-rich platforms and strategic partnerships.
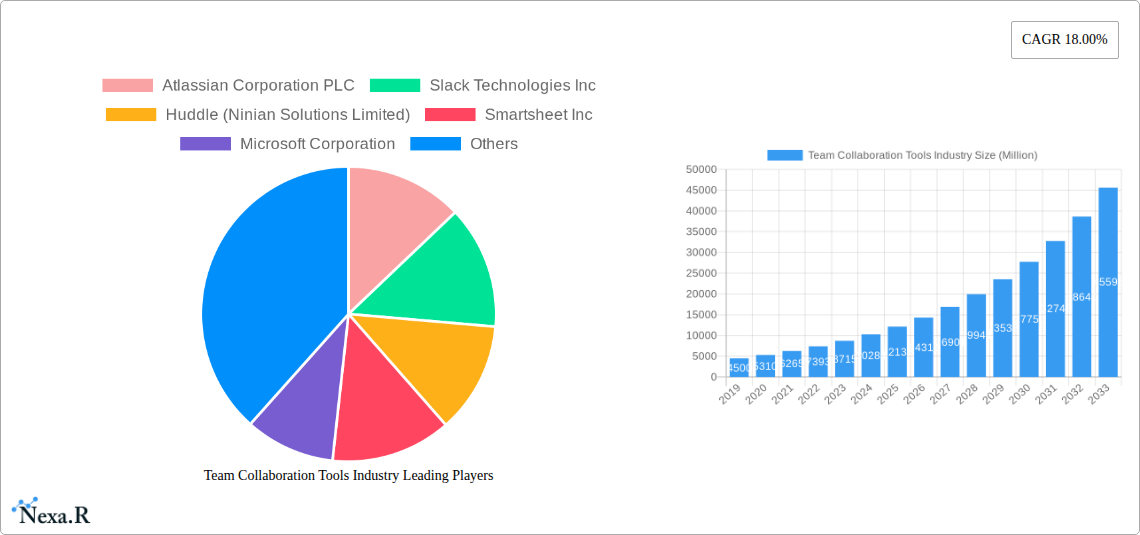
Team Collaboration Tools Industry Company Market Share
Comprehensive Report on the Team Collaboration Tools Industry: Market Dynamics, Growth Trends, and Future Outlook (2019-2033)
This in-depth report offers a critical analysis of the global Team Collaboration Tools market, providing essential insights for stakeholders navigating this rapidly evolving sector. Covering the Study Period: 2019–2033, with a Base Year: 2025, this report delivers a robust forecast for the Forecast Period: 2025–2033, building upon a detailed examination of the Historical Period: 2019–2024. We delve into market size, segmentation, regional dominance, technological advancements, and competitive landscapes, utilizing high-traffic keywords such as "team collaboration software," "project management tools," "communication platforms," "workflow automation," "digital workspace solutions," and "enterprise collaboration." The report also incorporates analysis of parent and child markets within the broader collaboration ecosystem. All quantitative values are presented in Million units.
Team Collaboration Tools Industry Market Dynamics & Structure
The Team Collaboration Tools industry is characterized by a dynamic and evolving market structure, influenced by a confluence of technological advancements, shifting end-user demands, and strategic corporate maneuvers. Market concentration is moderately fragmented, with key players like Atlassian Corporation PLC, Slack Technologies Inc. (now part of Salesforce), Microsoft Corporation, and Asana Inc. holding significant shares. However, the presence of numerous specialized vendors and emerging startups prevents outright oligopoly. Technological innovation remains a primary driver, fueled by the continuous demand for enhanced productivity, seamless communication, and integrated workflows. The proliferation of cloud-based solutions has democratized access to sophisticated tools, while on-premise deployments cater to organizations with stringent data security and compliance requirements.
- Market Concentration: Moderately fragmented with a mix of large, established players and agile niche providers.
- Technological Innovation Drivers: AI-powered automation, real-time communication enhancements, cross-platform integrations, and advanced analytics for team performance.
- Regulatory Frameworks: Evolving data privacy regulations (e.g., GDPR, CCPA) are influencing security features and data handling practices within collaboration tools.
- Competitive Product Substitutes: While direct substitutes are limited, functionalities overlap with general-purpose communication apps (e.g., email) and standalone productivity tools.
- End-User Demographics: A broad spectrum ranging from individual freelancers to large multinational corporations, with a growing emphasis on remote and hybrid workforces.
- M&A Trends: Significant consolidation observed as larger tech giants acquire innovative startups to expand their collaboration suites. For instance, the acquisition of Slack by Salesforce highlights the strategic importance of integrated communication and collaboration. The volume of M&A deals in the past five years is estimated at over 75, indicating a healthy appetite for growth and market share expansion.
Team Collaboration Tools Industry Growth Trends & Insights
The Team Collaboration Tools industry is on an upward trajectory, propelled by a fundamental shift in how businesses operate. The adoption of remote and hybrid work models, accelerated by global events, has cemented the indispensability of robust digital collaboration platforms. The market size has witnessed consistent growth, with an estimated market value of $22,500 million in the base year 2025, projected to expand significantly. Adoption rates for cloud-based solutions continue to outpace on-premise alternatives, driven by their scalability, accessibility, and lower upfront costs. Technological disruptions are a constant, with advancements in AI and machine learning enabling more intelligent features like automated task delegation, predictive analytics for project bottlenecks, and personalized user experiences. Consumer behavior is also evolving, with an increasing demand for user-friendly interfaces, seamless integration with existing business applications, and enhanced security features.
The CAGR for the forecast period is estimated at an impressive 14.5%, indicating substantial expansion. Market penetration is already high in developed economies but continues to grow in emerging markets as digitalization efforts gain momentum. Specific metrics reveal a substantial increase in the number of active users, with organizations increasingly investing in comprehensive collaboration suites rather than disparate tools. The shift from basic chat functionalities to comprehensive digital headquarters, offering integrated project management, document sharing, and video conferencing, is a defining trend. Furthermore, the growing need for cross-functional team alignment and improved internal communication in a distributed workforce environment directly fuels the demand for these sophisticated solutions. The impact of these trends is evident in the increasing average revenue per user (ARPU) as organizations recognize the strategic value of these platforms in driving overall business efficiency and employee engagement.
Dominant Regions, Countries, or Segments in Team Collaboration Tools Industry
The North America region, particularly the United States, currently stands as the dominant force in the Team Collaboration Tools industry, driven by a confluence of factors including early adoption of advanced technologies, a mature enterprise software ecosystem, and a high concentration of businesses embracing remote and hybrid work models. The presence of major technology companies and a robust venture capital landscape fosters continuous innovation and market expansion within this region. Cloud deployment models overwhelmingly lead, accounting for an estimated 85% of the market share, owing to their inherent flexibility, scalability, and cost-effectiveness. This dominance is further amplified by the substantial investment in digital transformation initiatives across various sectors.
Dominant Segment (Deployment): Cloud
- Market Share: Approximately 85% of the total market revenue.
- Key Drivers: Agility, scalability, accessibility for remote teams, reduced IT infrastructure burden, and rapid deployment capabilities.
- Growth Potential: Continues to expand as more organizations prioritize flexible work arrangements and seek cost-efficient, feature-rich solutions.
- Technological Advancements: Continuous improvements in cloud infrastructure, security protocols, and AI-driven features further solidify cloud's advantage.
Dominant Segment (Organization Size): Large Enterprises
- Market Share: While Small and Medium Enterprises (SMEs) represent a growing segment, Large Enterprises currently command a larger share of the market revenue due to higher per-user spending and the implementation of comprehensive, enterprise-grade collaboration suites.
- Key Drivers: Complex workflow requirements, need for advanced security and compliance features, integration with existing enterprise resource planning (ERP) and customer relationship management (CRM) systems, and a larger employee base requiring standardized collaboration solutions.
- Growth Potential: Sustained demand driven by the ongoing digital transformation of large organizations and the increasing focus on fostering seamless communication and project management across dispersed global teams.
- Strategic Importance: Large enterprises often act as early adopters and influencers, driving demand for new features and functionalities.
Other regions, such as Europe and Asia-Pacific, are exhibiting robust growth, fueled by increasing digital adoption and government initiatives promoting technology integration in businesses. The competitive landscape in these regions is intensifying, with both global players and local providers vying for market share.
Team Collaboration Tools Industry Product Landscape
The product landscape for team collaboration tools is characterized by a rich array of solutions designed to enhance communication, streamline workflows, and boost productivity. Innovations are centered on creating unified digital workspaces that integrate chat, video conferencing, file sharing, project management, and task automation. Unique selling propositions include AI-powered features for intelligent task assignment, real-time translation for global teams, and advanced analytics for performance monitoring. Technological advancements are rapidly integrating these disparate functionalities into cohesive platforms, offering intuitive user interfaces and robust integration capabilities with third-party applications. The focus is on delivering tailored experiences that adapt to the specific needs of diverse teams and industries, from agile software development to complex project management in creative fields.
Key Drivers, Barriers & Challenges in Team Collaboration Tools Industry
The Team Collaboration Tools industry is propelled by several key drivers, most notably the pervasive adoption of remote and hybrid work models, the increasing need for enhanced employee productivity and engagement, and the continuous demand for streamlined communication across geographically dispersed teams. Technological advancements, such as AI-powered automation and improved video conferencing capabilities, further accelerate market growth.
- Key Drivers:
- Remote and hybrid work adoption.
- Demand for enhanced productivity and engagement.
- Need for seamless cross-functional communication.
- Advancements in AI and automation.
However, the industry faces significant barriers and challenges. These include concerns surrounding data security and privacy, particularly with cloud-based solutions, leading some organizations to hesitate in adopting new tools. The complexity of integrating new platforms with existing legacy systems can also be a hurdle. Intense competition among a vast number of vendors, leading to market saturation and pricing pressures, is another significant challenge. Additionally, the cost of implementation and ongoing subscription fees can be a restraint for smaller businesses.
- Barriers & Challenges:
- Data security and privacy concerns.
- Integration complexities with legacy systems.
- Intense market competition and pricing pressures.
- Implementation and subscription costs.
- User adoption and training requirements.
Emerging Opportunities in Team Collaboration Tools Industry
Emerging opportunities within the Team Collaboration Tools industry are abundant, driven by evolving workplace dynamics and technological frontiers. The integration of generative AI to assist with content creation, meeting summaries, and even code development presents a significant avenue for innovation. Untapped markets, particularly in developing economies, offer substantial growth potential as businesses there increasingly embrace digital transformation. Furthermore, specialized collaboration tools tailored for specific industries, such as healthcare (for secure patient communication) or manufacturing (for on-site operational coordination), are poised for significant expansion. The increasing demand for virtual collaboration experiences that mimic in-person interactions, including advanced augmented and virtual reality integration, also represents a burgeoning area of opportunity.
Growth Accelerators in the Team Collaboration Tools Industry Industry
Several factors are acting as powerful growth accelerators for the Team Collaboration Tools industry. The continued normalization of flexible work arrangements globally ensures sustained demand for tools that facilitate effective remote and hybrid operations. Strategic partnerships between software providers and hardware manufacturers are creating more integrated and seamless user experiences. Furthermore, the increasing focus on employee well-being and engagement is driving the adoption of platforms that not only enhance productivity but also foster a sense of connection and community among team members, especially in distributed settings. The ongoing digital transformation initiatives across all sectors of the economy, coupled with investments in cloud infrastructure, are also providing a fertile ground for the expansion of collaboration solutions.
Key Players Shaping the Team Collaboration Tools Industry Market
- Atlassian Corporation PLC
- Slack Technologies Inc.
- Huddle (Ninian Solutions Limited)
- Smartsheet Inc.
- Microsoft Corporation
- TigerConnect Inc.
- Symphony Communication Services LLC
- Wrike Inc.
- Asana Inc.
- Cybozu Inc.
Notable Milestones in Team Collaboration Tools Industry Sector
- April 2022: Slack Technologies Inc. and Salesforce jointly announced the release of new tools designed to accelerate team performance. This includes the introduction of "digital HQ," offering customers extensive customization options for Slack, enabling workflow automation and adaptive workspaces tailored to specific team needs.
- February 2022: Asana Inc. unveiled Asana Flow, a suite of workflow tools focused on automating work movement within and between teams. This innovation allows project managers to create reusable workflows encompassing all necessary steps, data, and tools for project completion and approval, featuring a UI for planning cross-team handoffs and integrations.
In-Depth Team Collaboration Tools Industry Market Outlook
The future outlook for the Team Collaboration Tools industry remains exceptionally promising, driven by the enduring shift towards flexible work environments and the relentless pursuit of operational efficiency. The market will likely witness continued innovation in AI integration, leading to more intelligent automation and predictive capabilities within collaboration platforms. The expansion into emerging economies and the development of industry-specific solutions will unlock new revenue streams. Strategic acquisitions and partnerships will continue to shape the competitive landscape, leading to more comprehensive and integrated offerings. Organizations that effectively leverage these advanced collaboration tools will be well-positioned to enhance productivity, foster innovation, and cultivate a highly engaged and connected workforce in the years to come. The market is projected to reach an estimated value of $60,000 million by 2033, reflecting a strong compound annual growth rate.
Team Collaboration Tools Industry Segmentation
-
1. Type of Deployment
- 1.1. Cloud
- 1.2. On-premise
-
2. Organization Size
- 2.1. Small and Medium Enterprises
- 2.2. Large Enterprises
Team Collaboration Tools Industry Segmentation By Geography
-
1. North America
- 1.1. United States
- 1.2. Canada
-
2. Europe
- 2.1. Germany
- 2.2. United Kingdom
- 2.3. France
- 2.4. Rest of Europe
-
3. Asia Pacific
- 3.1. India
- 3.2. China
- 3.3. Japan
- 3.4. Rest of Asia Pacific
-
4. Latin America
- 4.1. Brazil
- 4.2. Argentina
- 4.3. Rest of Latin America
-
5. Middle East and Africa
- 5.1. United Arab Emirates
- 5.2. Saudi Arabia
- 5.3. Africa
- 5.4. Rest of Middle East and Africa
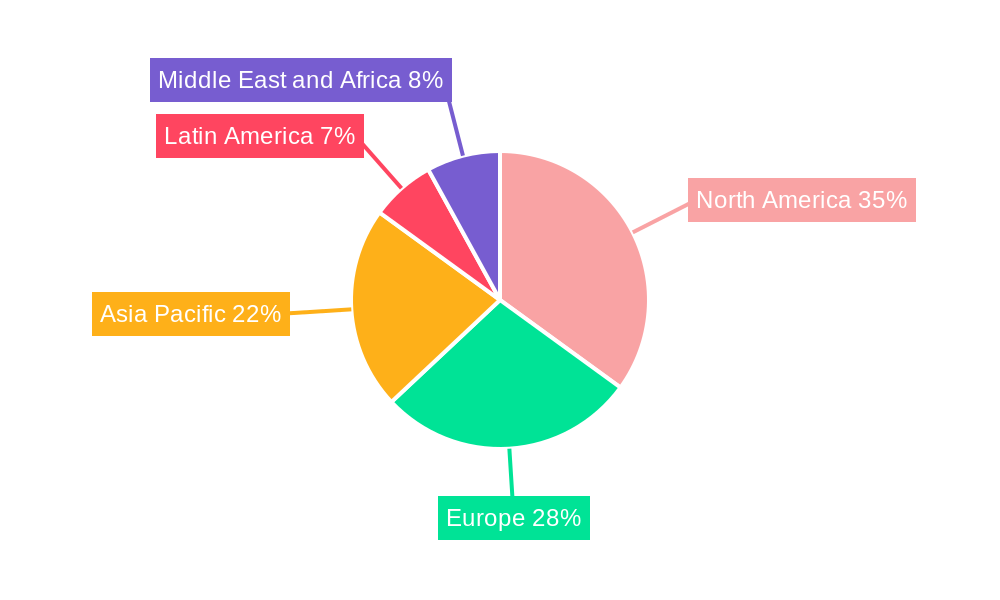
Team Collaboration Tools Industry Regional Market Share
Geographic Coverage of Team Collaboration Tools Industry
Team Collaboration Tools Industry REPORT HIGHLIGHTS
| Aspects | Details |
|---|---|
| Study Period | 2020-2034 |
| Base Year | 2025 |
| Estimated Year | 2026 |
| Forecast Period | 2026-2034 |
| Historical Period | 2020-2025 |
| Growth Rate | CAGR of 18.00% from 2020-2034 |
| Segmentation |
|
Table of Contents
- 1. Introduction
- 1.1. Research Scope
- 1.2. Market Segmentation
- 1.3. Research Methodology
- 1.4. Definitions and Assumptions
- 2. Executive Summary
- 2.1. Introduction
- 3. Market Dynamics
- 3.1. Introduction
- 3.2. Market Drivers
- 3.2.1. Increasing Need for Tools to Make Work Seamless and Agile; Continuous Innovation in Team Collaborative Tool Offerings
- 3.3. Market Restrains
- 3.3.1. Compliance and Governance Issues
- 3.4. Market Trends
- 3.4.1. Continuous Innovation in Team Collaboration Tool Offerings to Increase Market Growth
- 4. Market Factor Analysis
- 4.1. Porters Five Forces
- 4.2. Supply/Value Chain
- 4.3. PESTEL analysis
- 4.4. Market Entropy
- 4.5. Patent/Trademark Analysis
- 5. Global Team Collaboration Tools Industry Analysis, Insights and Forecast, 2020-2032
- 5.1. Market Analysis, Insights and Forecast - by Type of Deployment
- 5.1.1. Cloud
- 5.1.2. On-premise
- 5.2. Market Analysis, Insights and Forecast - by Organization Size
- 5.2.1. Small and Medium Enterprises
- 5.2.2. Large Enterprises
- 5.3. Market Analysis, Insights and Forecast - by Region
- 5.3.1. North America
- 5.3.2. Europe
- 5.3.3. Asia Pacific
- 5.3.4. Latin America
- 5.3.5. Middle East and Africa
- 5.1. Market Analysis, Insights and Forecast - by Type of Deployment
- 6. North America Team Collaboration Tools Industry Analysis, Insights and Forecast, 2020-2032
- 6.1. Market Analysis, Insights and Forecast - by Type of Deployment
- 6.1.1. Cloud
- 6.1.2. On-premise
- 6.2. Market Analysis, Insights and Forecast - by Organization Size
- 6.2.1. Small and Medium Enterprises
- 6.2.2. Large Enterprises
- 6.1. Market Analysis, Insights and Forecast - by Type of Deployment
- 7. Europe Team Collaboration Tools Industry Analysis, Insights and Forecast, 2020-2032
- 7.1. Market Analysis, Insights and Forecast - by Type of Deployment
- 7.1.1. Cloud
- 7.1.2. On-premise
- 7.2. Market Analysis, Insights and Forecast - by Organization Size
- 7.2.1. Small and Medium Enterprises
- 7.2.2. Large Enterprises
- 7.1. Market Analysis, Insights and Forecast - by Type of Deployment
- 8. Asia Pacific Team Collaboration Tools Industry Analysis, Insights and Forecast, 2020-2032
- 8.1. Market Analysis, Insights and Forecast - by Type of Deployment
- 8.1.1. Cloud
- 8.1.2. On-premise
- 8.2. Market Analysis, Insights and Forecast - by Organization Size
- 8.2.1. Small and Medium Enterprises
- 8.2.2. Large Enterprises
- 8.1. Market Analysis, Insights and Forecast - by Type of Deployment
- 9. Latin America Team Collaboration Tools Industry Analysis, Insights and Forecast, 2020-2032
- 9.1. Market Analysis, Insights and Forecast - by Type of Deployment
- 9.1.1. Cloud
- 9.1.2. On-premise
- 9.2. Market Analysis, Insights and Forecast - by Organization Size
- 9.2.1. Small and Medium Enterprises
- 9.2.2. Large Enterprises
- 9.1. Market Analysis, Insights and Forecast - by Type of Deployment
- 10. Middle East and Africa Team Collaboration Tools Industry Analysis, Insights and Forecast, 2020-2032
- 10.1. Market Analysis, Insights and Forecast - by Type of Deployment
- 10.1.1. Cloud
- 10.1.2. On-premise
- 10.2. Market Analysis, Insights and Forecast - by Organization Size
- 10.2.1. Small and Medium Enterprises
- 10.2.2. Large Enterprises
- 10.1. Market Analysis, Insights and Forecast - by Type of Deployment
- 11. Competitive Analysis
- 11.1. Global Market Share Analysis 2025
- 11.2. Company Profiles
- 11.2.1 Atlassian Corporation PLC
- 11.2.1.1. Overview
- 11.2.1.2. Products
- 11.2.1.3. SWOT Analysis
- 11.2.1.4. Recent Developments
- 11.2.1.5. Financials (Based on Availability)
- 11.2.2 Slack Technologies Inc
- 11.2.2.1. Overview
- 11.2.2.2. Products
- 11.2.2.3. SWOT Analysis
- 11.2.2.4. Recent Developments
- 11.2.2.5. Financials (Based on Availability)
- 11.2.3 Huddle (Ninian Solutions Limited)
- 11.2.3.1. Overview
- 11.2.3.2. Products
- 11.2.3.3. SWOT Analysis
- 11.2.3.4. Recent Developments
- 11.2.3.5. Financials (Based on Availability)
- 11.2.4 Smartsheet Inc
- 11.2.4.1. Overview
- 11.2.4.2. Products
- 11.2.4.3. SWOT Analysis
- 11.2.4.4. Recent Developments
- 11.2.4.5. Financials (Based on Availability)
- 11.2.5 Microsoft Corporation
- 11.2.5.1. Overview
- 11.2.5.2. Products
- 11.2.5.3. SWOT Analysis
- 11.2.5.4. Recent Developments
- 11.2.5.5. Financials (Based on Availability)
- 11.2.6 TigerConnect Inc
- 11.2.6.1. Overview
- 11.2.6.2. Products
- 11.2.6.3. SWOT Analysis
- 11.2.6.4. Recent Developments
- 11.2.6.5. Financials (Based on Availability)
- 11.2.7 Symphony Communication Services LLC
- 11.2.7.1. Overview
- 11.2.7.2. Products
- 11.2.7.3. SWOT Analysis
- 11.2.7.4. Recent Developments
- 11.2.7.5. Financials (Based on Availability)
- 11.2.8 Wrike Inc
- 11.2.8.1. Overview
- 11.2.8.2. Products
- 11.2.8.3. SWOT Analysis
- 11.2.8.4. Recent Developments
- 11.2.8.5. Financials (Based on Availability)
- 11.2.9 Asana Inc
- 11.2.9.1. Overview
- 11.2.9.2. Products
- 11.2.9.3. SWOT Analysis
- 11.2.9.4. Recent Developments
- 11.2.9.5. Financials (Based on Availability)
- 11.2.10 Cybozu Inc *List Not Exhaustive
- 11.2.10.1. Overview
- 11.2.10.2. Products
- 11.2.10.3. SWOT Analysis
- 11.2.10.4. Recent Developments
- 11.2.10.5. Financials (Based on Availability)
- 11.2.1 Atlassian Corporation PLC
List of Figures
- Figure 1: Global Team Collaboration Tools Industry Revenue Breakdown (Million, %) by Region 2025 & 2033
- Figure 2: North America Team Collaboration Tools Industry Revenue (Million), by Type of Deployment 2025 & 2033
- Figure 3: North America Team Collaboration Tools Industry Revenue Share (%), by Type of Deployment 2025 & 2033
- Figure 4: North America Team Collaboration Tools Industry Revenue (Million), by Organization Size 2025 & 2033
- Figure 5: North America Team Collaboration Tools Industry Revenue Share (%), by Organization Size 2025 & 2033
- Figure 6: North America Team Collaboration Tools Industry Revenue (Million), by Country 2025 & 2033
- Figure 7: North America Team Collaboration Tools Industry Revenue Share (%), by Country 2025 & 2033
- Figure 8: Europe Team Collaboration Tools Industry Revenue (Million), by Type of Deployment 2025 & 2033
- Figure 9: Europe Team Collaboration Tools Industry Revenue Share (%), by Type of Deployment 2025 & 2033
- Figure 10: Europe Team Collaboration Tools Industry Revenue (Million), by Organization Size 2025 & 2033
- Figure 11: Europe Team Collaboration Tools Industry Revenue Share (%), by Organization Size 2025 & 2033
- Figure 12: Europe Team Collaboration Tools Industry Revenue (Million), by Country 2025 & 2033
- Figure 13: Europe Team Collaboration Tools Industry Revenue Share (%), by Country 2025 & 2033
- Figure 14: Asia Pacific Team Collaboration Tools Industry Revenue (Million), by Type of Deployment 2025 & 2033
- Figure 15: Asia Pacific Team Collaboration Tools Industry Revenue Share (%), by Type of Deployment 2025 & 2033
- Figure 16: Asia Pacific Team Collaboration Tools Industry Revenue (Million), by Organization Size 2025 & 2033
- Figure 17: Asia Pacific Team Collaboration Tools Industry Revenue Share (%), by Organization Size 2025 & 2033
- Figure 18: Asia Pacific Team Collaboration Tools Industry Revenue (Million), by Country 2025 & 2033
- Figure 19: Asia Pacific Team Collaboration Tools Industry Revenue Share (%), by Country 2025 & 2033
- Figure 20: Latin America Team Collaboration Tools Industry Revenue (Million), by Type of Deployment 2025 & 2033
- Figure 21: Latin America Team Collaboration Tools Industry Revenue Share (%), by Type of Deployment 2025 & 2033
- Figure 22: Latin America Team Collaboration Tools Industry Revenue (Million), by Organization Size 2025 & 2033
- Figure 23: Latin America Team Collaboration Tools Industry Revenue Share (%), by Organization Size 2025 & 2033
- Figure 24: Latin America Team Collaboration Tools Industry Revenue (Million), by Country 2025 & 2033
- Figure 25: Latin America Team Collaboration Tools Industry Revenue Share (%), by Country 2025 & 2033
- Figure 26: Middle East and Africa Team Collaboration Tools Industry Revenue (Million), by Type of Deployment 2025 & 2033
- Figure 27: Middle East and Africa Team Collaboration Tools Industry Revenue Share (%), by Type of Deployment 2025 & 2033
- Figure 28: Middle East and Africa Team Collaboration Tools Industry Revenue (Million), by Organization Size 2025 & 2033
- Figure 29: Middle East and Africa Team Collaboration Tools Industry Revenue Share (%), by Organization Size 2025 & 2033
- Figure 30: Middle East and Africa Team Collaboration Tools Industry Revenue (Million), by Country 2025 & 2033
- Figure 31: Middle East and Africa Team Collaboration Tools Industry Revenue Share (%), by Country 2025 & 2033
List of Tables
- Table 1: Global Team Collaboration Tools Industry Revenue Million Forecast, by Type of Deployment 2020 & 2033
- Table 2: Global Team Collaboration Tools Industry Revenue Million Forecast, by Organization Size 2020 & 2033
- Table 3: Global Team Collaboration Tools Industry Revenue Million Forecast, by Region 2020 & 2033
- Table 4: Global Team Collaboration Tools Industry Revenue Million Forecast, by Type of Deployment 2020 & 2033
- Table 5: Global Team Collaboration Tools Industry Revenue Million Forecast, by Organization Size 2020 & 2033
- Table 6: Global Team Collaboration Tools Industry Revenue Million Forecast, by Country 2020 & 2033
- Table 7: United States Team Collaboration Tools Industry Revenue (Million) Forecast, by Application 2020 & 2033
- Table 8: Canada Team Collaboration Tools Industry Revenue (Million) Forecast, by Application 2020 & 2033
- Table 9: Global Team Collaboration Tools Industry Revenue Million Forecast, by Type of Deployment 2020 & 2033
- Table 10: Global Team Collaboration Tools Industry Revenue Million Forecast, by Organization Size 2020 & 2033
- Table 11: Global Team Collaboration Tools Industry Revenue Million Forecast, by Country 2020 & 2033
- Table 12: Germany Team Collaboration Tools Industry Revenue (Million) Forecast, by Application 2020 & 2033
- Table 13: United Kingdom Team Collaboration Tools Industry Revenue (Million) Forecast, by Application 2020 & 2033
- Table 14: France Team Collaboration Tools Industry Revenue (Million) Forecast, by Application 2020 & 2033
- Table 15: Rest of Europe Team Collaboration Tools Industry Revenue (Million) Forecast, by Application 2020 & 2033
- Table 16: Global Team Collaboration Tools Industry Revenue Million Forecast, by Type of Deployment 2020 & 2033
- Table 17: Global Team Collaboration Tools Industry Revenue Million Forecast, by Organization Size 2020 & 2033
- Table 18: Global Team Collaboration Tools Industry Revenue Million Forecast, by Country 2020 & 2033
- Table 19: India Team Collaboration Tools Industry Revenue (Million) Forecast, by Application 2020 & 2033
- Table 20: China Team Collaboration Tools Industry Revenue (Million) Forecast, by Application 2020 & 2033
- Table 21: Japan Team Collaboration Tools Industry Revenue (Million) Forecast, by Application 2020 & 2033
- Table 22: Rest of Asia Pacific Team Collaboration Tools Industry Revenue (Million) Forecast, by Application 2020 & 2033
- Table 23: Global Team Collaboration Tools Industry Revenue Million Forecast, by Type of Deployment 2020 & 2033
- Table 24: Global Team Collaboration Tools Industry Revenue Million Forecast, by Organization Size 2020 & 2033
- Table 25: Global Team Collaboration Tools Industry Revenue Million Forecast, by Country 2020 & 2033
- Table 26: Brazil Team Collaboration Tools Industry Revenue (Million) Forecast, by Application 2020 & 2033
- Table 27: Argentina Team Collaboration Tools Industry Revenue (Million) Forecast, by Application 2020 & 2033
- Table 28: Rest of Latin America Team Collaboration Tools Industry Revenue (Million) Forecast, by Application 2020 & 2033
- Table 29: Global Team Collaboration Tools Industry Revenue Million Forecast, by Type of Deployment 2020 & 2033
- Table 30: Global Team Collaboration Tools Industry Revenue Million Forecast, by Organization Size 2020 & 2033
- Table 31: Global Team Collaboration Tools Industry Revenue Million Forecast, by Country 2020 & 2033
- Table 32: United Arab Emirates Team Collaboration Tools Industry Revenue (Million) Forecast, by Application 2020 & 2033
- Table 33: Saudi Arabia Team Collaboration Tools Industry Revenue (Million) Forecast, by Application 2020 & 2033
- Table 34: Africa Team Collaboration Tools Industry Revenue (Million) Forecast, by Application 2020 & 2033
- Table 35: Rest of Middle East and Africa Team Collaboration Tools Industry Revenue (Million) Forecast, by Application 2020 & 2033
Frequently Asked Questions
1. What is the projected Compound Annual Growth Rate (CAGR) of the Team Collaboration Tools Industry?
The projected CAGR is approximately 18.00%.
2. Which companies are prominent players in the Team Collaboration Tools Industry?
Key companies in the market include Atlassian Corporation PLC, Slack Technologies Inc, Huddle (Ninian Solutions Limited), Smartsheet Inc, Microsoft Corporation, TigerConnect Inc, Symphony Communication Services LLC, Wrike Inc, Asana Inc, Cybozu Inc *List Not Exhaustive.
3. What are the main segments of the Team Collaboration Tools Industry?
The market segments include Type of Deployment, Organization Size.
4. Can you provide details about the market size?
The market size is estimated to be USD XX Million as of 2022.
5. What are some drivers contributing to market growth?
Increasing Need for Tools to Make Work Seamless and Agile; Continuous Innovation in Team Collaborative Tool Offerings.
6. What are the notable trends driving market growth?
Continuous Innovation in Team Collaboration Tool Offerings to Increase Market Growth.
7. Are there any restraints impacting market growth?
Compliance and Governance Issues.
8. Can you provide examples of recent developments in the market?
April 2022: Slack Technologies Inc., along with Salesforce, announced the release of new tools to accelerate team performance. This includes the digital HQ to give customers unlimited ways to customize Slack, automate workflows, and adapt their workspaces to meet the specific needs of their teams.
9. What pricing options are available for accessing the report?
Pricing options include single-user, multi-user, and enterprise licenses priced at USD 4750, USD 5250, and USD 8750 respectively.
10. Is the market size provided in terms of value or volume?
The market size is provided in terms of value, measured in Million.
11. Are there any specific market keywords associated with the report?
Yes, the market keyword associated with the report is "Team Collaboration Tools Industry," which aids in identifying and referencing the specific market segment covered.
12. How do I determine which pricing option suits my needs best?
The pricing options vary based on user requirements and access needs. Individual users may opt for single-user licenses, while businesses requiring broader access may choose multi-user or enterprise licenses for cost-effective access to the report.
13. Are there any additional resources or data provided in the Team Collaboration Tools Industry report?
While the report offers comprehensive insights, it's advisable to review the specific contents or supplementary materials provided to ascertain if additional resources or data are available.
14. How can I stay updated on further developments or reports in the Team Collaboration Tools Industry?
To stay informed about further developments, trends, and reports in the Team Collaboration Tools Industry, consider subscribing to industry newsletters, following relevant companies and organizations, or regularly checking reputable industry news sources and publications.
Methodology
Step 1 - Identification of Relevant Samples Size from Population Database


Step 2 - Approaches for Defining Global Market Size (Value, Volume* & Price*)

Note*: In applicable scenarios
Step 3 - Data Sources
Primary Research
- Web Analytics
- Survey Reports
- Research Institute
- Latest Research Reports
- Opinion Leaders
Secondary Research
- Annual Reports
- White Paper
- Latest Press Release
- Industry Association
- Paid Database
- Investor Presentations

Step 4 - Data Triangulation
Involves using different sources of information in order to increase the validity of a study
These sources are likely to be stakeholders in a program - participants, other researchers, program staff, other community members, and so on.
Then we put all data in single framework & apply various statistical tools to find out the dynamic on the market.
During the analysis stage, feedback from the stakeholder groups would be compared to determine areas of agreement as well as areas of divergence
