

Key Insights
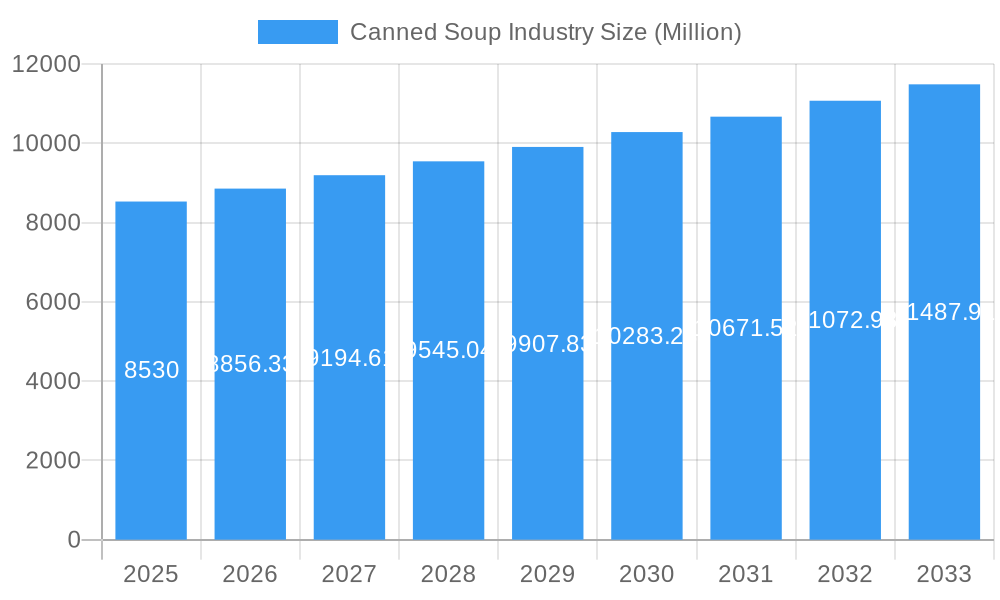
The canned soup market, valued at $8.53 billion in 2025, is projected to experience steady growth, driven by factors such as increasing consumer demand for convenient and ready-to-eat meals, growing health consciousness reflected in the rise of organic options, and the expanding e-commerce sector. The market's Compound Annual Growth Rate (CAGR) of 4.01% from 2025 to 2033 indicates a positive outlook, although the growth rate might fluctuate year-to-year depending on economic conditions and evolving consumer preferences. The ready-to-eat segment is expected to dominate, propelled by busy lifestyles and a preference for quick meal solutions. Within distribution channels, supermarkets and hypermarkets maintain a significant share, although online retail is showing substantial growth, fueled by increased online grocery shopping. The organic segment is also anticipated to experience faster growth than the conventional segment, reflecting the rising demand for healthier and naturally produced food products. Key players like Campbell Soup Company, General Mills Inc., and Unilever PLC are leveraging their established brand presence and distribution networks to maintain their market share. Regional variations exist; North America and Europe likely hold the largest market shares, although the Asia-Pacific region presents significant growth potential driven by rising disposable incomes and changing dietary habits. Competition is intense, with companies focusing on product innovation, such as introducing new flavors and healthier options, to attract and retain consumers.
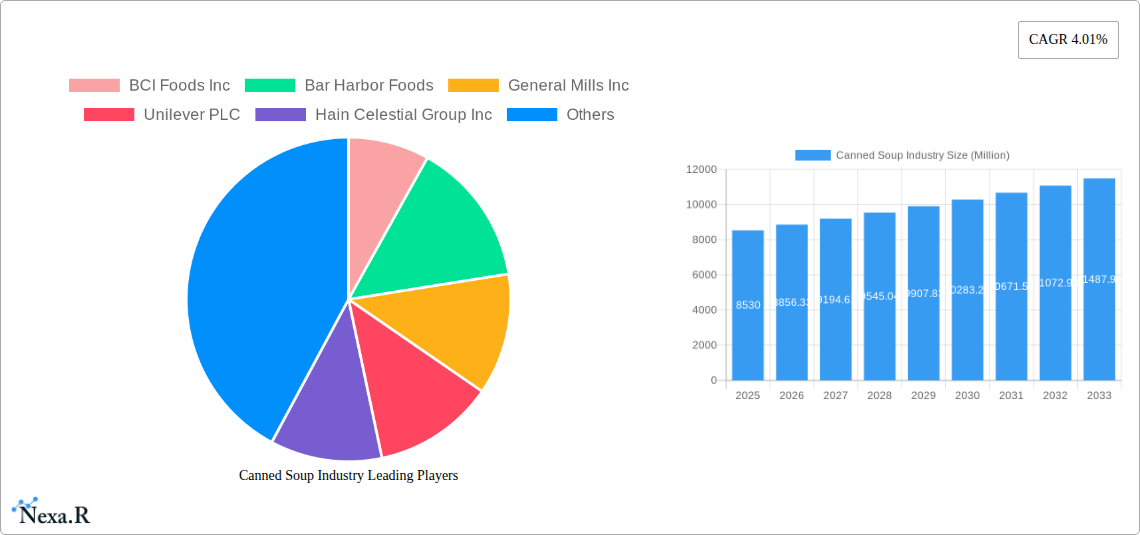
Canned Soup Industry Market Size (In Billion)
The canned soup industry faces certain restraints, including increasing competition from fresh and frozen soup alternatives, fluctuating raw material prices (particularly for key ingredients like vegetables and meat), and concerns about high sodium content in some products. Companies are addressing these challenges through strategic initiatives like reformulation of recipes to reduce sodium and sugar, adopting sustainable sourcing practices, and investing in marketing campaigns that highlight the convenience and nutritional benefits of their products. The market is expected to see further consolidation as larger players acquire smaller companies, leading to increased brand dominance and potential market share shifts. Sustained growth will depend on continued innovation, effective marketing strategies that target evolving consumer needs and preferences, and the ability of manufacturers to effectively manage rising production costs.
Canned Soup Industry Company Market Share
Canned Soup Industry Market Report: 2019-2033
This comprehensive report provides an in-depth analysis of the Canned Soup industry, encompassing market dynamics, growth trends, competitive landscape, and future outlook. The study period covers 2019-2033, with 2025 as the base and estimated year. The report leverages extensive market research to deliver actionable insights for industry professionals, investors, and stakeholders. Parent markets include the broader processed food industry and child markets include specific soup types (condensed, ready-to-eat), categories (conventional, organic) and distribution channels.
Canned Soup Industry Market Dynamics & Structure
This section analyzes the market structure, revealing a moderately concentrated landscape with key players such as Campbell Soup Company, The Kraft Heinz Company, and Unilever PLC holding significant market share (xx%). Market concentration is further assessed through the Herfindahl-Hirschman Index (HHI) calculation (xx). Technological innovation, primarily focusing on improved packaging, extended shelf life, and healthier recipes, is a key driver. Regulatory frameworks concerning food safety and labeling impact product development and marketing strategies. Competitive substitutes include ready meals, fresh soups, and instant noodles, exerting pressure on market share. End-user demographics show a preference for convenience and health-conscious options, impacting product formulation and marketing. M&A activity in the industry has been moderate (xx deals in the last five years), with larger players aiming for portfolio diversification and market expansion.
- Market Concentration: Moderately concentrated (xx% held by top 5 players).
- Technological Innovation: Focus on shelf life extension, sustainable packaging, and healthier recipes.
- Regulatory Landscape: Stringent food safety and labeling regulations influence product development.
- Competitive Substitutes: Ready meals, fresh soups, and instant noodles.
- End-User Demographics: Growing demand for convenient and healthier options.
- M&A Activity: Moderate activity (xx deals in the last 5 years), driven by diversification and expansion.
Canned Soup Industry Growth Trends & Insights
The canned soup market exhibited steady growth during the historical period (2019-2024), with a CAGR of xx%. This growth has been influenced by factors such as rising disposable incomes in developing economies, changing consumer lifestyles favoring convenience, and product diversification into healthier and organic options. However, challenges such as increased competition and shifting consumer preferences towards fresh food have impacted growth rates. The market is expected to witness continued growth in the forecast period (2025-2033), driven by innovation in product offerings, expanding distribution channels, and increasing consumer demand in emerging markets. Market penetration of organic and ready-to-eat canned soups is expected to increase significantly in the forecast period, reaching xx% by 2033. Technological disruptions, including advanced packaging technologies and automation in manufacturing, are expected to improve efficiency and reduce costs. Shifts in consumer behavior towards healthier, more convenient food options are driving demand for low-sodium, organic, and plant-based canned soup varieties.
Dominant Regions, Countries, or Segments in Canned Soup Industry
North America and Europe currently dominate the canned soup market, accounting for xx% of global revenue in 2025. The dominance is driven by high per capita consumption, established distribution networks, and a well-developed food processing industry. However, Asia-Pacific is anticipated to witness the fastest growth in the forecast period, fueled by rising disposable incomes, expanding urbanization, and changing consumer preferences.
Type: The ready-to-eat segment is projected to experience faster growth due to its convenience factor. Category: Organic canned soups are gaining traction, although conventional varieties maintain the largest market share. Distribution Channel: Supermarkets/hypermarkets currently hold the largest market share; however, online retail is showing significant growth potential.
- Key Drivers in North America: High per capita consumption, well-established distribution networks.
- Key Drivers in Europe: Strong demand for convenience and established food processing industry.
- Key Drivers in Asia-Pacific: Rising disposable incomes, urbanization, changing consumer preferences.
- Growth Potential: Asia-Pacific displays the highest growth potential.
Canned Soup Industry Product Landscape
The canned soup market offers a diverse range of products, catering to various tastes and dietary needs. Innovations focus on enhancing taste, convenience, and health benefits. Products such as low-sodium, organic, and plant-based soups are gaining popularity. Technological advancements include improved packaging materials for extended shelf life and retort pouch technology for better product quality. Unique selling propositions include flavors, convenient packaging, and health benefits.
Key Drivers, Barriers & Challenges in Canned Soup Industry
Key Drivers: Rising disposable incomes, changing lifestyles favoring convenience, increasing demand for healthier options, product innovation (plant-based, organic).
Challenges: Intense competition, fluctuations in raw material prices, consumer preference for fresh food, stringent regulatory compliance, supply chain disruptions (xx% increase in transportation costs in 2022 resulting in xx million units decrease in production).
Emerging Opportunities in Canned Soup Industry
Emerging opportunities include expanding into untapped markets (e.g., Africa, Latin America), developing innovative product formats (e.g., single-serving pouches), and focusing on premium and niche segments (e.g., gourmet soups, ethnic flavors). Meeting the growing demand for healthy and sustainable products offers significant potential.
Growth Accelerators in the Canned Soup Industry
Long-term growth will be driven by strategic partnerships, technological advancements in packaging and processing, and expansion into new geographical markets. Leveraging e-commerce platforms to reach wider consumer segments will also play a crucial role.
Key Players Shaping the Canned Soup Industry Market
- BCI Foods Inc
- Bar Harbor Foods
- General Mills Inc
- Unilever PLC
- Hain Celestial Group Inc
- F Whitlock & Sons
- The Kraft Heinz Company
- Baxters Food Group Limited
- Amy's Kitchen Inc
- Campbell Soup Company
- Sprague Foods Ltd
Notable Milestones in Canned Soup Industry Sector
- January 2023: Heinz UK launched plant-based soup products.
- January 2023: Campbell Soup Company launched Chunky Ghost pepper chicken noodle soup.
- April 2023: F Whitlock & Sons launched a new range of canned soups.
In-Depth Canned Soup Industry Market Outlook
The canned soup market is poised for continued growth, driven by innovation, expanding distribution channels, and evolving consumer preferences. Strategic partnerships and expansion into new markets will be crucial for success. Focusing on health-conscious and convenient options will be key to capturing market share in the coming years. The market is projected to reach xx million units by 2033, presenting substantial opportunities for both established players and new entrants.
Canned Soup Industry Segmentation
-
1. Type
- 1.1. Condensed
- 1.2. Ready-to-Eat
-
2. Category
- 2.1. Conventional
- 2.2. Organic
-
3. Distribution Channel
- 3.1. Supermarkets/Hypermarkets
- 3.2. Convenience/Grocery Stores
- 3.3. Food Specialty Stores
- 3.4. Online Retail Stores
- 3.5. Other Distribution Channels
Canned Soup Industry Segmentation By Geography
-
1. North America
- 1.1. United States
- 1.2. Canada
- 1.3. Mexico
- 1.4. Rest of North America
-
2. Europe
- 2.1. Spain
- 2.2. United Kingdom
- 2.3. Germany
- 2.4. France
- 2.5. Italy
- 2.6. Russia
- 2.7. Rest of Europe
-
3. Asia Pacific
- 3.1. China
- 3.2. Japan
- 3.3. India
- 3.4. Australia
- 3.5. Rest of Asia Pacific
-
4. South America
- 4.1. Brazil
- 4.2. Argentina
- 4.3. Rest of South America
-
5. Middle East and Africa
- 5.1. South Africa
- 5.2. United Arab Emirates
- 5.3. Rest of Middle East and Africa
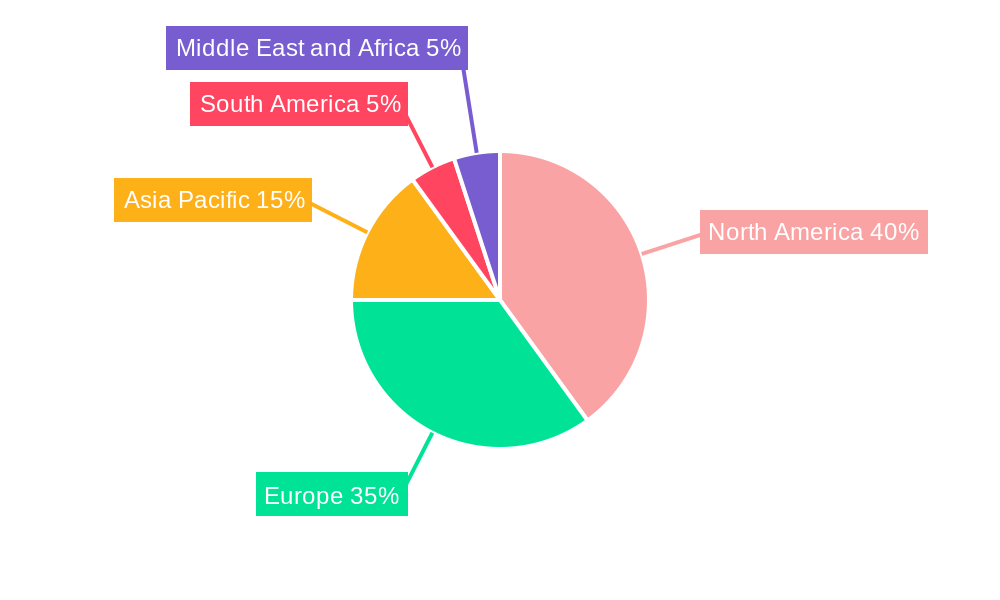
Canned Soup Industry Regional Market Share
Geographic Coverage of Canned Soup Industry
Canned Soup Industry REPORT HIGHLIGHTS
| Aspects | Details |
|---|---|
| Study Period | 2020-2034 |
| Base Year | 2025 |
| Estimated Year | 2026 |
| Forecast Period | 2026-2034 |
| Historical Period | 2020-2025 |
| Growth Rate | CAGR of 4.01% from 2020-2034 |
| Segmentation |
|
Table of Contents
- 1. Introduction
- 1.1. Research Scope
- 1.2. Market Segmentation
- 1.3. Research Methodology
- 1.4. Definitions and Assumptions
- 2. Executive Summary
- 2.1. Introduction
- 3. Market Dynamics
- 3.1. Introduction
- 3.2. Market Drivers
- 3.2.1. Increasing Expenditure on Convenience Food Products; The Growing Trend of Vegan Food Products Drives the Market of Plant-based Canned Soup Market
- 3.3. Market Restrains
- 3.3.1. Food additives present in Canned Soup products can hinder the market growth
- 3.4. Market Trends
- 3.4.1. Rise in Spending on Convenience Products
- 4. Market Factor Analysis
- 4.1. Porters Five Forces
- 4.2. Supply/Value Chain
- 4.3. PESTEL analysis
- 4.4. Market Entropy
- 4.5. Patent/Trademark Analysis
- 5. Global Canned Soup Industry Analysis, Insights and Forecast, 2020-2032
- 5.1. Market Analysis, Insights and Forecast - by Type
- 5.1.1. Condensed
- 5.1.2. Ready-to-Eat
- 5.2. Market Analysis, Insights and Forecast - by Category
- 5.2.1. Conventional
- 5.2.2. Organic
- 5.3. Market Analysis, Insights and Forecast - by Distribution Channel
- 5.3.1. Supermarkets/Hypermarkets
- 5.3.2. Convenience/Grocery Stores
- 5.3.3. Food Specialty Stores
- 5.3.4. Online Retail Stores
- 5.3.5. Other Distribution Channels
- 5.4. Market Analysis, Insights and Forecast - by Region
- 5.4.1. North America
- 5.4.2. Europe
- 5.4.3. Asia Pacific
- 5.4.4. South America
- 5.4.5. Middle East and Africa
- 5.1. Market Analysis, Insights and Forecast - by Type
- 6. North America Canned Soup Industry Analysis, Insights and Forecast, 2020-2032
- 6.1. Market Analysis, Insights and Forecast - by Type
- 6.1.1. Condensed
- 6.1.2. Ready-to-Eat
- 6.2. Market Analysis, Insights and Forecast - by Category
- 6.2.1. Conventional
- 6.2.2. Organic
- 6.3. Market Analysis, Insights and Forecast - by Distribution Channel
- 6.3.1. Supermarkets/Hypermarkets
- 6.3.2. Convenience/Grocery Stores
- 6.3.3. Food Specialty Stores
- 6.3.4. Online Retail Stores
- 6.3.5. Other Distribution Channels
- 6.1. Market Analysis, Insights and Forecast - by Type
- 7. Europe Canned Soup Industry Analysis, Insights and Forecast, 2020-2032
- 7.1. Market Analysis, Insights and Forecast - by Type
- 7.1.1. Condensed
- 7.1.2. Ready-to-Eat
- 7.2. Market Analysis, Insights and Forecast - by Category
- 7.2.1. Conventional
- 7.2.2. Organic
- 7.3. Market Analysis, Insights and Forecast - by Distribution Channel
- 7.3.1. Supermarkets/Hypermarkets
- 7.3.2. Convenience/Grocery Stores
- 7.3.3. Food Specialty Stores
- 7.3.4. Online Retail Stores
- 7.3.5. Other Distribution Channels
- 7.1. Market Analysis, Insights and Forecast - by Type
- 8. Asia Pacific Canned Soup Industry Analysis, Insights and Forecast, 2020-2032
- 8.1. Market Analysis, Insights and Forecast - by Type
- 8.1.1. Condensed
- 8.1.2. Ready-to-Eat
- 8.2. Market Analysis, Insights and Forecast - by Category
- 8.2.1. Conventional
- 8.2.2. Organic
- 8.3. Market Analysis, Insights and Forecast - by Distribution Channel
- 8.3.1. Supermarkets/Hypermarkets
- 8.3.2. Convenience/Grocery Stores
- 8.3.3. Food Specialty Stores
- 8.3.4. Online Retail Stores
- 8.3.5. Other Distribution Channels
- 8.1. Market Analysis, Insights and Forecast - by Type
- 9. South America Canned Soup Industry Analysis, Insights and Forecast, 2020-2032
- 9.1. Market Analysis, Insights and Forecast - by Type
- 9.1.1. Condensed
- 9.1.2. Ready-to-Eat
- 9.2. Market Analysis, Insights and Forecast - by Category
- 9.2.1. Conventional
- 9.2.2. Organic
- 9.3. Market Analysis, Insights and Forecast - by Distribution Channel
- 9.3.1. Supermarkets/Hypermarkets
- 9.3.2. Convenience/Grocery Stores
- 9.3.3. Food Specialty Stores
- 9.3.4. Online Retail Stores
- 9.3.5. Other Distribution Channels
- 9.1. Market Analysis, Insights and Forecast - by Type
- 10. Middle East and Africa Canned Soup Industry Analysis, Insights and Forecast, 2020-2032
- 10.1. Market Analysis, Insights and Forecast - by Type
- 10.1.1. Condensed
- 10.1.2. Ready-to-Eat
- 10.2. Market Analysis, Insights and Forecast - by Category
- 10.2.1. Conventional
- 10.2.2. Organic
- 10.3. Market Analysis, Insights and Forecast - by Distribution Channel
- 10.3.1. Supermarkets/Hypermarkets
- 10.3.2. Convenience/Grocery Stores
- 10.3.3. Food Specialty Stores
- 10.3.4. Online Retail Stores
- 10.3.5. Other Distribution Channels
- 10.1. Market Analysis, Insights and Forecast - by Type
- 11. Competitive Analysis
- 11.1. Global Market Share Analysis 2025
- 11.2. Company Profiles
- 11.2.1 BCI Foods Inc
- 11.2.1.1. Overview
- 11.2.1.2. Products
- 11.2.1.3. SWOT Analysis
- 11.2.1.4. Recent Developments
- 11.2.1.5. Financials (Based on Availability)
- 11.2.2 Bar Harbor Foods
- 11.2.2.1. Overview
- 11.2.2.2. Products
- 11.2.2.3. SWOT Analysis
- 11.2.2.4. Recent Developments
- 11.2.2.5. Financials (Based on Availability)
- 11.2.3 General Mills Inc
- 11.2.3.1. Overview
- 11.2.3.2. Products
- 11.2.3.3. SWOT Analysis
- 11.2.3.4. Recent Developments
- 11.2.3.5. Financials (Based on Availability)
- 11.2.4 Unilever PLC
- 11.2.4.1. Overview
- 11.2.4.2. Products
- 11.2.4.3. SWOT Analysis
- 11.2.4.4. Recent Developments
- 11.2.4.5. Financials (Based on Availability)
- 11.2.5 Hain Celestial Group Inc
- 11.2.5.1. Overview
- 11.2.5.2. Products
- 11.2.5.3. SWOT Analysis
- 11.2.5.4. Recent Developments
- 11.2.5.5. Financials (Based on Availability)
- 11.2.6 F Whitlock & Sons
- 11.2.6.1. Overview
- 11.2.6.2. Products
- 11.2.6.3. SWOT Analysis
- 11.2.6.4. Recent Developments
- 11.2.6.5. Financials (Based on Availability)
- 11.2.7 The Kraft Heinz Company
- 11.2.7.1. Overview
- 11.2.7.2. Products
- 11.2.7.3. SWOT Analysis
- 11.2.7.4. Recent Developments
- 11.2.7.5. Financials (Based on Availability)
- 11.2.8 Baxters Food Group Limited
- 11.2.8.1. Overview
- 11.2.8.2. Products
- 11.2.8.3. SWOT Analysis
- 11.2.8.4. Recent Developments
- 11.2.8.5. Financials (Based on Availability)
- 11.2.9 Amy's Kitchen Inc
- 11.2.9.1. Overview
- 11.2.9.2. Products
- 11.2.9.3. SWOT Analysis
- 11.2.9.4. Recent Developments
- 11.2.9.5. Financials (Based on Availability)
- 11.2.10 Campbell Soup Company
- 11.2.10.1. Overview
- 11.2.10.2. Products
- 11.2.10.3. SWOT Analysis
- 11.2.10.4. Recent Developments
- 11.2.10.5. Financials (Based on Availability)
- 11.2.11 Sprague Foods Ltd
- 11.2.11.1. Overview
- 11.2.11.2. Products
- 11.2.11.3. SWOT Analysis
- 11.2.11.4. Recent Developments
- 11.2.11.5. Financials (Based on Availability)
- 11.2.1 BCI Foods Inc
List of Figures
- Figure 1: Global Canned Soup Industry Revenue Breakdown (Million, %) by Region 2025 & 2033
- Figure 2: North America Canned Soup Industry Revenue (Million), by Type 2025 & 2033
- Figure 3: North America Canned Soup Industry Revenue Share (%), by Type 2025 & 2033
- Figure 4: North America Canned Soup Industry Revenue (Million), by Category 2025 & 2033
- Figure 5: North America Canned Soup Industry Revenue Share (%), by Category 2025 & 2033
- Figure 6: North America Canned Soup Industry Revenue (Million), by Distribution Channel 2025 & 2033
- Figure 7: North America Canned Soup Industry Revenue Share (%), by Distribution Channel 2025 & 2033
- Figure 8: North America Canned Soup Industry Revenue (Million), by Country 2025 & 2033
- Figure 9: North America Canned Soup Industry Revenue Share (%), by Country 2025 & 2033
- Figure 10: Europe Canned Soup Industry Revenue (Million), by Type 2025 & 2033
- Figure 11: Europe Canned Soup Industry Revenue Share (%), by Type 2025 & 2033
- Figure 12: Europe Canned Soup Industry Revenue (Million), by Category 2025 & 2033
- Figure 13: Europe Canned Soup Industry Revenue Share (%), by Category 2025 & 2033
- Figure 14: Europe Canned Soup Industry Revenue (Million), by Distribution Channel 2025 & 2033
- Figure 15: Europe Canned Soup Industry Revenue Share (%), by Distribution Channel 2025 & 2033
- Figure 16: Europe Canned Soup Industry Revenue (Million), by Country 2025 & 2033
- Figure 17: Europe Canned Soup Industry Revenue Share (%), by Country 2025 & 2033
- Figure 18: Asia Pacific Canned Soup Industry Revenue (Million), by Type 2025 & 2033
- Figure 19: Asia Pacific Canned Soup Industry Revenue Share (%), by Type 2025 & 2033
- Figure 20: Asia Pacific Canned Soup Industry Revenue (Million), by Category 2025 & 2033
- Figure 21: Asia Pacific Canned Soup Industry Revenue Share (%), by Category 2025 & 2033
- Figure 22: Asia Pacific Canned Soup Industry Revenue (Million), by Distribution Channel 2025 & 2033
- Figure 23: Asia Pacific Canned Soup Industry Revenue Share (%), by Distribution Channel 2025 & 2033
- Figure 24: Asia Pacific Canned Soup Industry Revenue (Million), by Country 2025 & 2033
- Figure 25: Asia Pacific Canned Soup Industry Revenue Share (%), by Country 2025 & 2033
- Figure 26: South America Canned Soup Industry Revenue (Million), by Type 2025 & 2033
- Figure 27: South America Canned Soup Industry Revenue Share (%), by Type 2025 & 2033
- Figure 28: South America Canned Soup Industry Revenue (Million), by Category 2025 & 2033
- Figure 29: South America Canned Soup Industry Revenue Share (%), by Category 2025 & 2033
- Figure 30: South America Canned Soup Industry Revenue (Million), by Distribution Channel 2025 & 2033
- Figure 31: South America Canned Soup Industry Revenue Share (%), by Distribution Channel 2025 & 2033
- Figure 32: South America Canned Soup Industry Revenue (Million), by Country 2025 & 2033
- Figure 33: South America Canned Soup Industry Revenue Share (%), by Country 2025 & 2033
- Figure 34: Middle East and Africa Canned Soup Industry Revenue (Million), by Type 2025 & 2033
- Figure 35: Middle East and Africa Canned Soup Industry Revenue Share (%), by Type 2025 & 2033
- Figure 36: Middle East and Africa Canned Soup Industry Revenue (Million), by Category 2025 & 2033
- Figure 37: Middle East and Africa Canned Soup Industry Revenue Share (%), by Category 2025 & 2033
- Figure 38: Middle East and Africa Canned Soup Industry Revenue (Million), by Distribution Channel 2025 & 2033
- Figure 39: Middle East and Africa Canned Soup Industry Revenue Share (%), by Distribution Channel 2025 & 2033
- Figure 40: Middle East and Africa Canned Soup Industry Revenue (Million), by Country 2025 & 2033
- Figure 41: Middle East and Africa Canned Soup Industry Revenue Share (%), by Country 2025 & 2033
List of Tables
- Table 1: Global Canned Soup Industry Revenue Million Forecast, by Type 2020 & 2033
- Table 2: Global Canned Soup Industry Revenue Million Forecast, by Category 2020 & 2033
- Table 3: Global Canned Soup Industry Revenue Million Forecast, by Distribution Channel 2020 & 2033
- Table 4: Global Canned Soup Industry Revenue Million Forecast, by Region 2020 & 2033
- Table 5: Global Canned Soup Industry Revenue Million Forecast, by Type 2020 & 2033
- Table 6: Global Canned Soup Industry Revenue Million Forecast, by Category 2020 & 2033
- Table 7: Global Canned Soup Industry Revenue Million Forecast, by Distribution Channel 2020 & 2033
- Table 8: Global Canned Soup Industry Revenue Million Forecast, by Country 2020 & 2033
- Table 9: United States Canned Soup Industry Revenue (Million) Forecast, by Application 2020 & 2033
- Table 10: Canada Canned Soup Industry Revenue (Million) Forecast, by Application 2020 & 2033
- Table 11: Mexico Canned Soup Industry Revenue (Million) Forecast, by Application 2020 & 2033
- Table 12: Rest of North America Canned Soup Industry Revenue (Million) Forecast, by Application 2020 & 2033
- Table 13: Global Canned Soup Industry Revenue Million Forecast, by Type 2020 & 2033
- Table 14: Global Canned Soup Industry Revenue Million Forecast, by Category 2020 & 2033
- Table 15: Global Canned Soup Industry Revenue Million Forecast, by Distribution Channel 2020 & 2033
- Table 16: Global Canned Soup Industry Revenue Million Forecast, by Country 2020 & 2033
- Table 17: Spain Canned Soup Industry Revenue (Million) Forecast, by Application 2020 & 2033
- Table 18: United Kingdom Canned Soup Industry Revenue (Million) Forecast, by Application 2020 & 2033
- Table 19: Germany Canned Soup Industry Revenue (Million) Forecast, by Application 2020 & 2033
- Table 20: France Canned Soup Industry Revenue (Million) Forecast, by Application 2020 & 2033
- Table 21: Italy Canned Soup Industry Revenue (Million) Forecast, by Application 2020 & 2033
- Table 22: Russia Canned Soup Industry Revenue (Million) Forecast, by Application 2020 & 2033
- Table 23: Rest of Europe Canned Soup Industry Revenue (Million) Forecast, by Application 2020 & 2033
- Table 24: Global Canned Soup Industry Revenue Million Forecast, by Type 2020 & 2033
- Table 25: Global Canned Soup Industry Revenue Million Forecast, by Category 2020 & 2033
- Table 26: Global Canned Soup Industry Revenue Million Forecast, by Distribution Channel 2020 & 2033
- Table 27: Global Canned Soup Industry Revenue Million Forecast, by Country 2020 & 2033
- Table 28: China Canned Soup Industry Revenue (Million) Forecast, by Application 2020 & 2033
- Table 29: Japan Canned Soup Industry Revenue (Million) Forecast, by Application 2020 & 2033
- Table 30: India Canned Soup Industry Revenue (Million) Forecast, by Application 2020 & 2033
- Table 31: Australia Canned Soup Industry Revenue (Million) Forecast, by Application 2020 & 2033
- Table 32: Rest of Asia Pacific Canned Soup Industry Revenue (Million) Forecast, by Application 2020 & 2033
- Table 33: Global Canned Soup Industry Revenue Million Forecast, by Type 2020 & 2033
- Table 34: Global Canned Soup Industry Revenue Million Forecast, by Category 2020 & 2033
- Table 35: Global Canned Soup Industry Revenue Million Forecast, by Distribution Channel 2020 & 2033
- Table 36: Global Canned Soup Industry Revenue Million Forecast, by Country 2020 & 2033
- Table 37: Brazil Canned Soup Industry Revenue (Million) Forecast, by Application 2020 & 2033
- Table 38: Argentina Canned Soup Industry Revenue (Million) Forecast, by Application 2020 & 2033
- Table 39: Rest of South America Canned Soup Industry Revenue (Million) Forecast, by Application 2020 & 2033
- Table 40: Global Canned Soup Industry Revenue Million Forecast, by Type 2020 & 2033
- Table 41: Global Canned Soup Industry Revenue Million Forecast, by Category 2020 & 2033
- Table 42: Global Canned Soup Industry Revenue Million Forecast, by Distribution Channel 2020 & 2033
- Table 43: Global Canned Soup Industry Revenue Million Forecast, by Country 2020 & 2033
- Table 44: South Africa Canned Soup Industry Revenue (Million) Forecast, by Application 2020 & 2033
- Table 45: United Arab Emirates Canned Soup Industry Revenue (Million) Forecast, by Application 2020 & 2033
- Table 46: Rest of Middle East and Africa Canned Soup Industry Revenue (Million) Forecast, by Application 2020 & 2033
Frequently Asked Questions
1. What is the projected Compound Annual Growth Rate (CAGR) of the Canned Soup Industry?
The projected CAGR is approximately 4.01%.
2. Which companies are prominent players in the Canned Soup Industry?
Key companies in the market include BCI Foods Inc, Bar Harbor Foods, General Mills Inc, Unilever PLC, Hain Celestial Group Inc, F Whitlock & Sons, The Kraft Heinz Company, Baxters Food Group Limited, Amy's Kitchen Inc, Campbell Soup Company, Sprague Foods Ltd.
3. What are the main segments of the Canned Soup Industry?
The market segments include Type, Category, Distribution Channel.
4. Can you provide details about the market size?
The market size is estimated to be USD 8.53 Million as of 2022.
5. What are some drivers contributing to market growth?
Increasing Expenditure on Convenience Food Products; The Growing Trend of Vegan Food Products Drives the Market of Plant-based Canned Soup Market.
6. What are the notable trends driving market growth?
Rise in Spending on Convenience Products.
7. Are there any restraints impacting market growth?
Food additives present in Canned Soup products can hinder the market growth.
8. Can you provide examples of recent developments in the market?
April 2023: F Whitlock & Sons announced the launch of its new range of canned soups in three flavors. The launch includes new flavors such as peri-peri chicken, Moroccan spiced carrot and lentil soup, Louisiana-style tomato, capsicum, and corn gumbo. The company also claims that the range has no artificial colors, preservatives, or flavors.
9. What pricing options are available for accessing the report?
Pricing options include single-user, multi-user, and enterprise licenses priced at USD 4750, USD 5250, and USD 8750 respectively.
10. Is the market size provided in terms of value or volume?
The market size is provided in terms of value, measured in Million.
11. Are there any specific market keywords associated with the report?
Yes, the market keyword associated with the report is "Canned Soup Industry," which aids in identifying and referencing the specific market segment covered.
12. How do I determine which pricing option suits my needs best?
The pricing options vary based on user requirements and access needs. Individual users may opt for single-user licenses, while businesses requiring broader access may choose multi-user or enterprise licenses for cost-effective access to the report.
13. Are there any additional resources or data provided in the Canned Soup Industry report?
While the report offers comprehensive insights, it's advisable to review the specific contents or supplementary materials provided to ascertain if additional resources or data are available.
14. How can I stay updated on further developments or reports in the Canned Soup Industry?
To stay informed about further developments, trends, and reports in the Canned Soup Industry, consider subscribing to industry newsletters, following relevant companies and organizations, or regularly checking reputable industry news sources and publications.
Methodology
Step 1 - Identification of Relevant Samples Size from Population Database


Step 2 - Approaches for Defining Global Market Size (Value, Volume* & Price*)

Note*: In applicable scenarios
Step 3 - Data Sources
Primary Research
- Web Analytics
- Survey Reports
- Research Institute
- Latest Research Reports
- Opinion Leaders
Secondary Research
- Annual Reports
- White Paper
- Latest Press Release
- Industry Association
- Paid Database
- Investor Presentations

Step 4 - Data Triangulation
Involves using different sources of information in order to increase the validity of a study
These sources are likely to be stakeholders in a program - participants, other researchers, program staff, other community members, and so on.
Then we put all data in single framework & apply various statistical tools to find out the dynamic on the market.
During the analysis stage, feedback from the stakeholder groups would be compared to determine areas of agreement as well as areas of divergence