

Key Insights
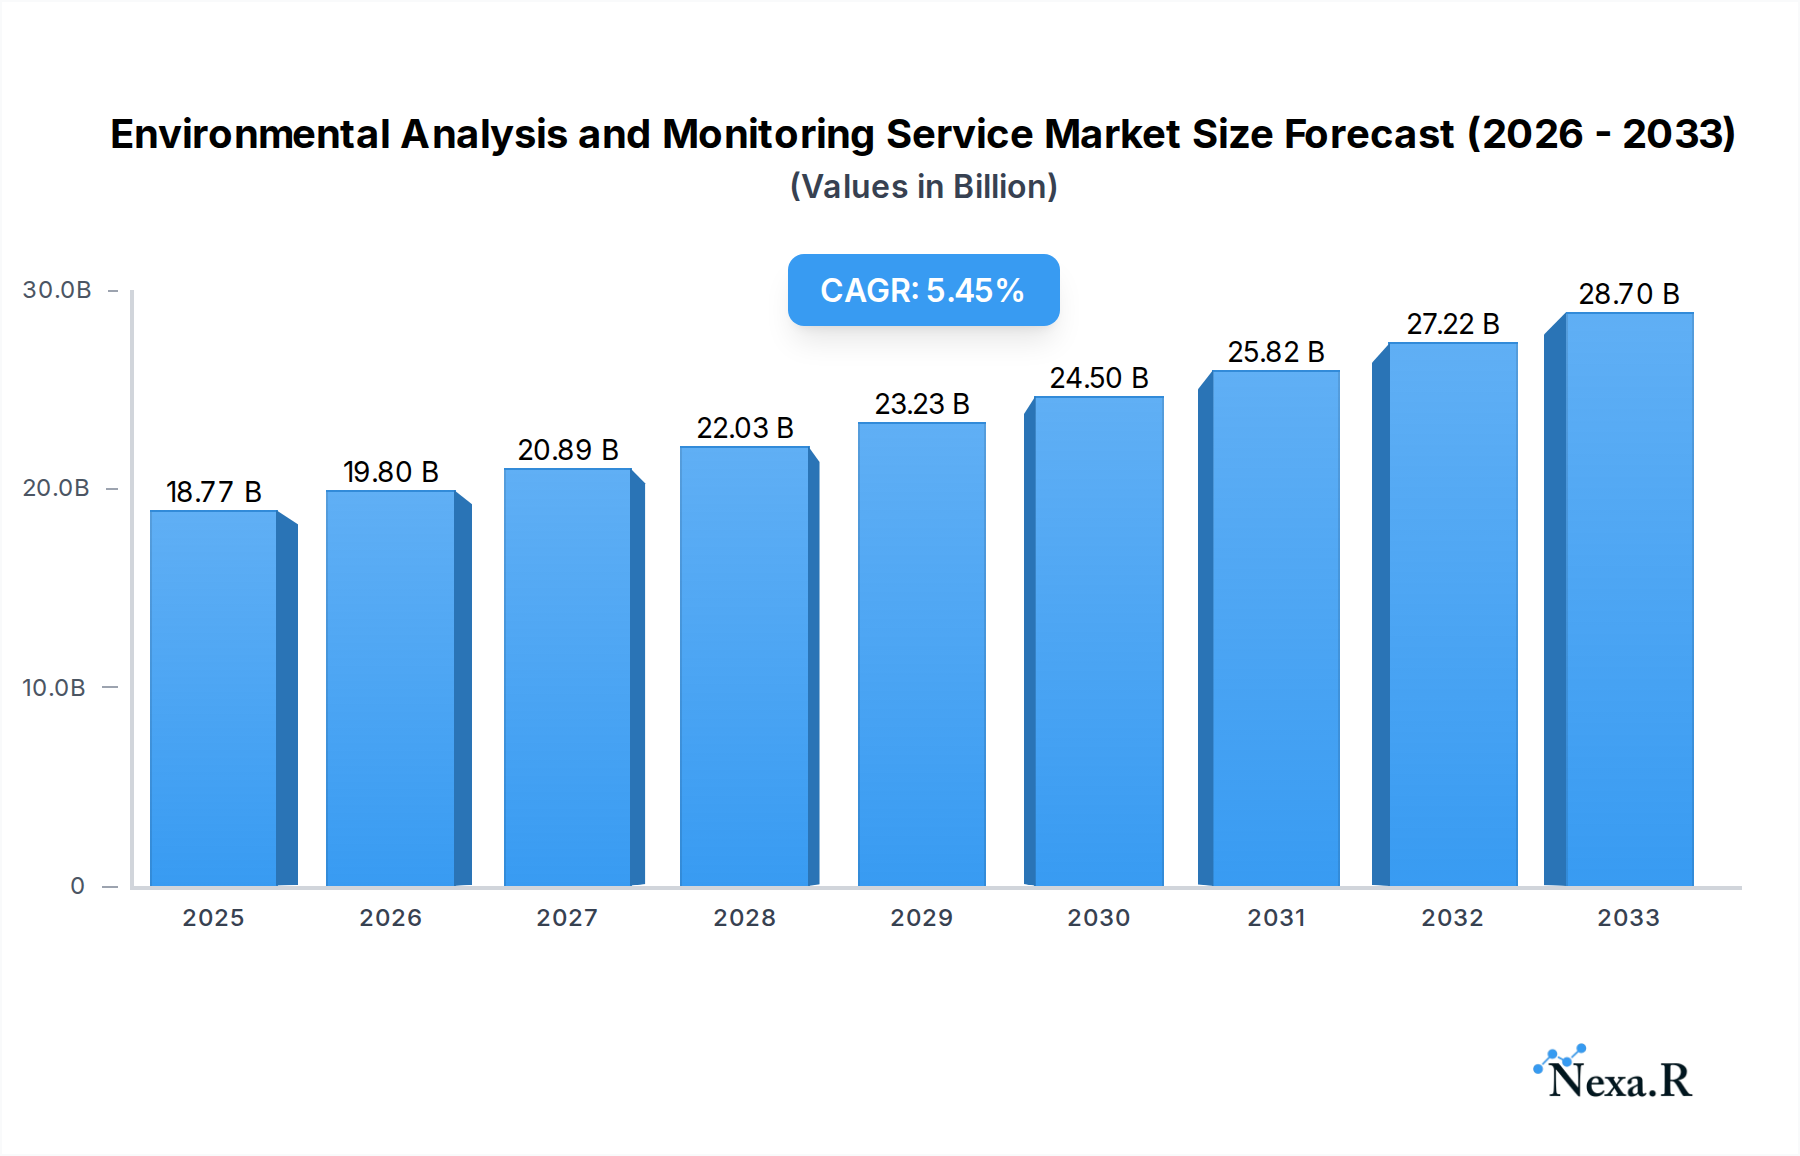
The global Environmental Analysis and Monitoring Service market is projected to reach a substantial $18.77 billion in 2025, driven by an increasingly stringent regulatory landscape and a growing global emphasis on sustainability. The market is expected to witness a robust Compound Annual Growth Rate (CAGR) of 5.5% from 2025 to 2033, indicating sustained expansion and evolving market dynamics. Key growth drivers include the escalating need for industrial compliance, proactive measures in construction to mitigate environmental impact, and the critical demand for precise monitoring in the oil and gas and pharmaceutical sectors. As environmental awareness permeates across industries, the application of these services is diversifying, encompassing vital areas such as Environmental Impact Assessment, Water Quality Monitoring, and Air Quality Monitoring, among others. This growth trajectory is further bolstered by advancements in analytical technologies and data interpretation capabilities, enabling more accurate and comprehensive environmental assessments.

Environmental Analysis and Monitoring Service Market Size (In Billion)
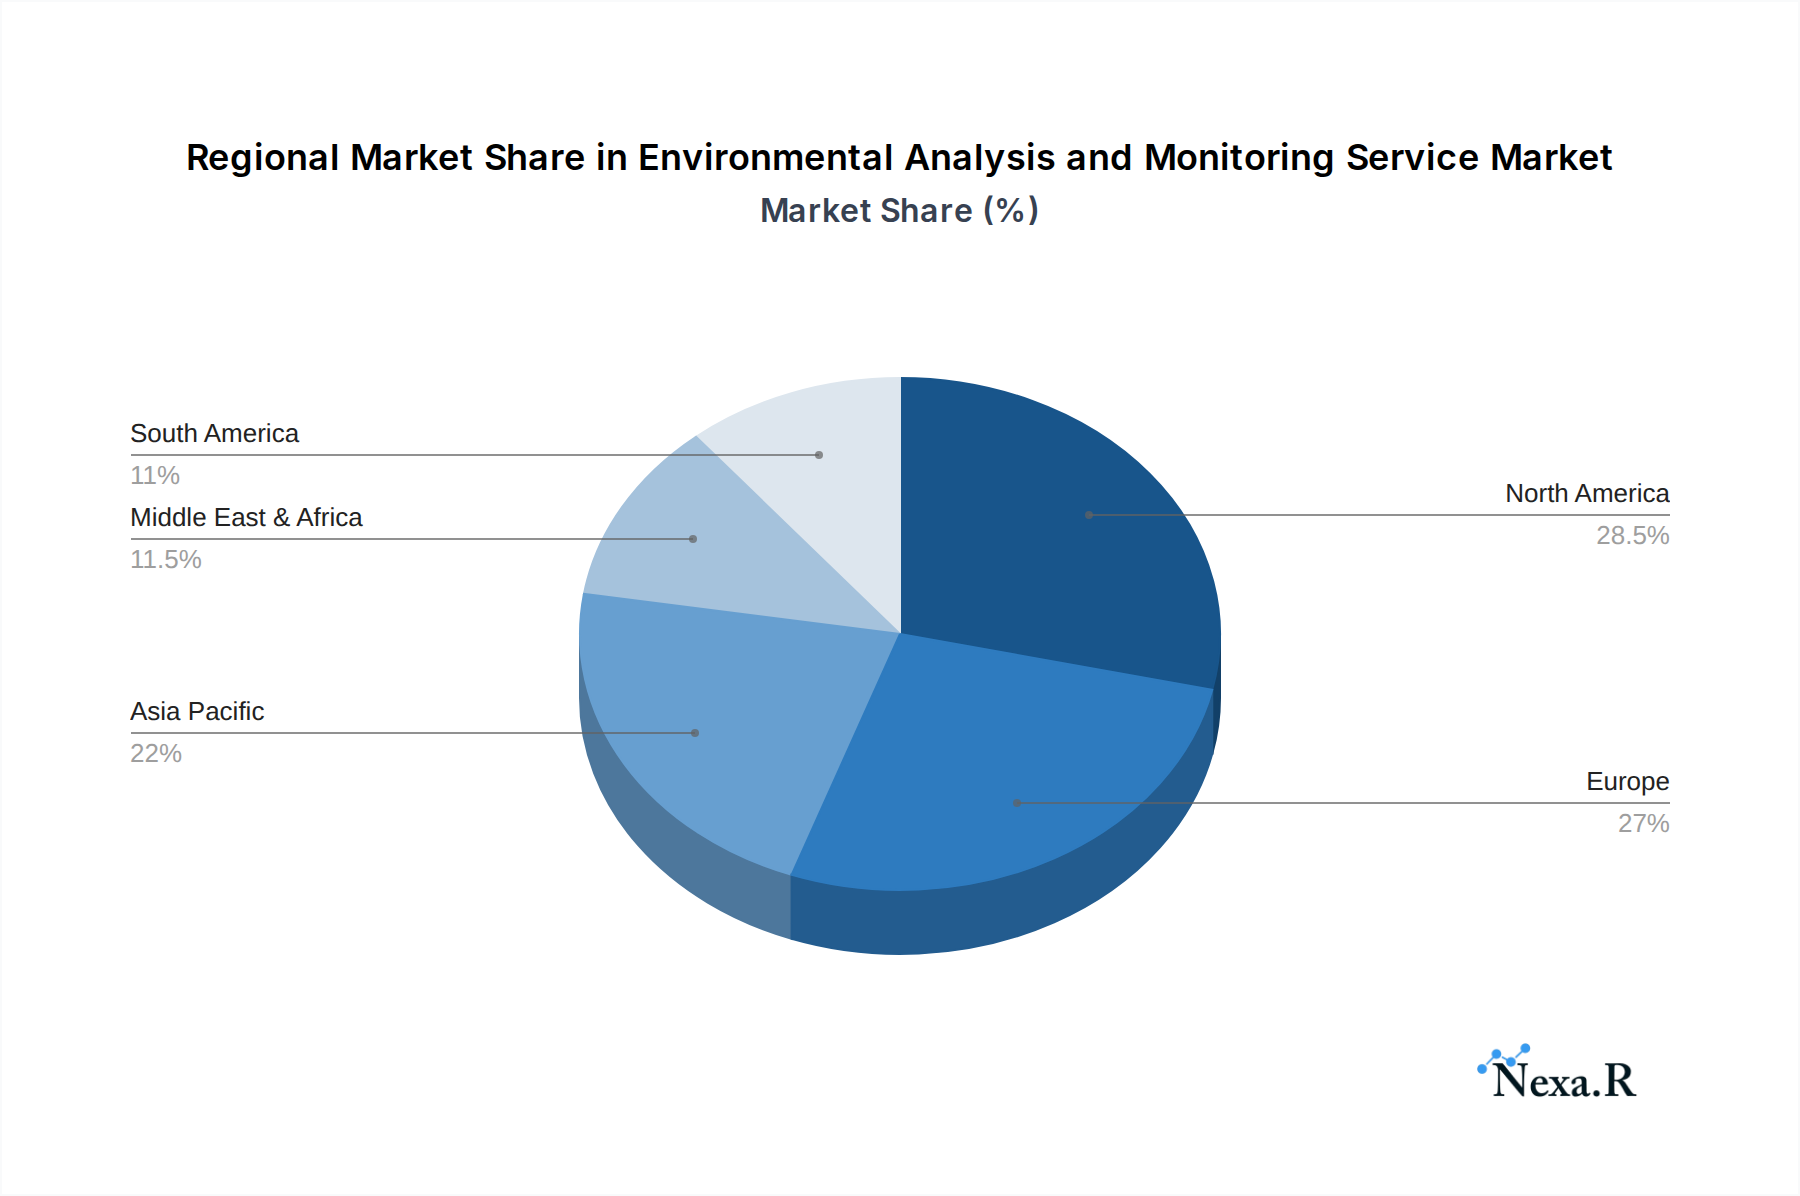
The market's expansion is characterized by a dynamic interplay of factors. While the demand for environmental analysis and monitoring services is propelled by government mandates, corporate social responsibility initiatives, and the increasing occurrence of environmental-related incidents, certain challenges temper its growth. These include the high cost of advanced analytical equipment, the scarcity of skilled professionals, and the time-consuming nature of comprehensive environmental testing. However, the market demonstrates resilience and innovation. Key players like Eurofins Scientific, ALS, Bureau Veritas, DNV, and SGS are at the forefront, offering a wide array of services and solutions. Geographically, North America and Europe currently hold significant market shares, owing to well-established environmental regulations and a mature industrial base. The Asia Pacific region, with its rapid industrialization and growing environmental concerns, presents a significant opportunity for future growth. The forecast period anticipates a continued upward trend, underscoring the indispensable role of environmental analysis and monitoring in safeguarding public health and ecological balance.
Environmental Analysis and Monitoring Service Company Market Share
Environmental Analysis and Monitoring Service Market: Comprehensive Insights and Future Outlook
This report provides an in-depth analysis of the global Environmental Analysis and Monitoring Service market, offering critical insights into its dynamics, growth trends, regional dominance, product landscape, key drivers, barriers, emerging opportunities, growth accelerators, and the competitive ecosystem. Designed for industry professionals, investors, and stakeholders, this report leverages high-traffic keywords and a structured format to maximize SEO visibility and deliver actionable intelligence. The parent market, encompassing all environmental services, is projected to reach xx billion by 2033, with the Environmental Analysis and Monitoring Service segment, a vital child market, expected to witness robust expansion.
Environmental Analysis and Monitoring Service Market Dynamics & Structure
The Environmental Analysis and Monitoring Service market is characterized by a moderate level of concentration, with a few large players holding significant market share while a substantial number of smaller and regional entities also contribute to the landscape. Technological innovation is a primary driver, fueled by advancements in sensor technology, data analytics, IoT integration, and remote sensing capabilities, enabling more accurate, real-time, and cost-effective monitoring solutions. Stringent regulatory frameworks and increasing environmental awareness across both developed and developing economies are compelling industries to adopt advanced analysis and monitoring services. The competitive product substitute landscape includes in-house monitoring capabilities, but the expertise, advanced instrumentation, and impartiality offered by specialized service providers often outweigh these alternatives. End-user demographics are diverse, spanning industrial facilities, construction projects, oil and gas exploration, pharmaceutical manufacturing, and various other sectors requiring environmental compliance and risk management. Mergers and acquisitions (M&A) are a significant trend, with companies seeking to expand their service portfolios, geographical reach, and technological capabilities. For instance, in the historical period (2019-2024), there were approximately xx M&A deals valued at over xx billion, indicating a consolidation drive within the industry. Barriers to innovation include high capital investment for advanced equipment, lengthy validation processes for new methodologies, and the need for highly skilled personnel.
Environmental Analysis and Monitoring Service Growth Trends & Insights
The global Environmental Analysis and Monitoring Service market is poised for substantial growth, driven by a confluence of factors that are reshaping industrial practices and regulatory landscapes. From a market size perspective, the sector is projected to grow from approximately xx billion in the base year of 2025 to an estimated xx billion by 2033, exhibiting a Compound Annual Growth Rate (CAGR) of xx% during the forecast period of 2025–2033. This expansion is underpinned by escalating environmental consciousness and the imperative for industries to adhere to increasingly stringent national and international regulations concerning pollution control, resource management, and sustainability.
Adoption rates for advanced environmental monitoring solutions are accelerating across various sectors. For example, the uptake of real-time air quality monitoring systems in urban areas and industrial zones has surged by xx% in the past five years. Technological disruptions are a major catalyst, with the integration of artificial intelligence (AI) and machine learning (ML) into data analysis platforms revolutionizing the way environmental data is interpreted and utilized. This enables predictive modeling for potential environmental incidents, early detection of pollutants, and optimization of compliance strategies. The Internet of Things (IoT) is also playing a pivotal role, facilitating the deployment of vast networks of interconnected sensors that provide continuous streams of environmental data, from water quality parameters to soil composition and greenhouse gas emissions.
Consumer behavior shifts are indirectly influencing market growth. Growing demand for sustainably produced goods and increased public scrutiny of corporate environmental footprints are compelling businesses to invest more heavily in environmental performance, which directly translates to a greater need for comprehensive analysis and monitoring services. Furthermore, the growing emphasis on Environmental, Social, and Governance (ESG) investing is pushing corporations to demonstrate robust environmental stewardship, making sophisticated monitoring a critical component of their reporting and strategy. The impact of climate change concerns and the need for robust environmental impact assessments (EIAs) for new projects further amplify the demand for these specialized services.
Dominant Regions, Countries, or Segments in Environmental Analysis and Monitoring Service
The Environmental Analysis and Monitoring Service market exhibits significant regional variations in dominance, primarily driven by economic development, regulatory stringency, and the concentration of key industrial activities. North America and Europe currently stand as the leading regions, collectively accounting for over xx% of the global market share in the base year of 2025. This dominance is attributed to well-established regulatory frameworks such as the Clean Air Act and Clean Water Act in the United States, and the European Union's extensive environmental directives, which mandate rigorous monitoring and reporting for a wide array of industrial operations.
Within North America, the United States is a paramount country, propelled by a massive industrial base encompassing oil and gas, pharmaceuticals, and manufacturing, all of which necessitate extensive environmental analysis and monitoring. The country's advanced technological infrastructure and high adoption rate of cutting-edge monitoring solutions further solidify its position. In Europe, Germany and the United Kingdom are key contributors, with strong emphasis on industrial emissions monitoring, water quality assessment, and environmental impact assessments for infrastructure projects.
From an application perspective, Industrial Monitoring is the most dominant segment, representing approximately xx% of the global market share in 2025. This segment encompasses continuous monitoring of emissions, effluents, and workplace environments across diverse industries such as chemical production, power generation, and heavy manufacturing. The relentless pressure to comply with emissions standards and ensure worker safety drives consistent demand.
The Water Quality Monitoring type is also a critical and rapidly growing segment, expected to capture xx% of the market by 2033. This is due to increasing concerns over water scarcity, pollution from agricultural runoff, industrial discharge, and the need to ensure safe drinking water supplies globally. Government initiatives and public health concerns are significant drivers for this segment.
Key drivers for regional dominance include robust governmental policies that enforce environmental compliance, substantial investments in research and development of monitoring technologies, and the presence of a well-developed network of specialized environmental service providers. For instance, the increasing focus on renewable energy projects in Europe has spurred demand for environmental impact assessments and monitoring services to mitigate ecological disruptions. Furthermore, economic policies that incentivize green technologies and sustainable practices contribute to market expansion in these dominant regions. The growth potential in emerging economies is also considerable, though currently outpaced by established markets due to varying regulatory enforcement and economic development stages.
Environmental Analysis and Monitoring Service Product Landscape
The product landscape of Environmental Analysis and Monitoring Services is characterized by a continuous evolution towards greater precision, automation, and data integration. Innovations are primarily focused on developing sophisticated sensing technologies for real-time detection of a wider spectrum of pollutants, including volatile organic compounds (VOCs), heavy metals, and microplastics. Applications span the spectrum from continuous stack emission monitoring in heavy industries to highly sensitive water quality analysis for potable water and ecosystem health assessments. Performance metrics are increasingly defined by lower detection limits, faster analysis turnaround times, and enhanced data accuracy and reliability. Unique selling propositions often lie in the integration of AI and cloud-based platforms for advanced data analytics, predictive modeling, and remote monitoring capabilities, offering clients actionable insights and proactive environmental management. Technological advancements include the development of portable, miniaturized sensors and drones equipped with specialized monitoring equipment for difficult-to-access or hazardous locations.
Key Drivers, Barriers & Challenges in Environmental Analysis and Monitoring Service
Key Drivers:
- Stringent Environmental Regulations: Increasing global focus on pollution control, climate change mitigation, and sustainable development mandates stricter environmental monitoring and reporting.
- Technological Advancements: Innovations in sensor technology, AI, IoT, and data analytics enable more accurate, real-time, and cost-effective environmental monitoring.
- Growing Environmental Awareness: Rising public and corporate consciousness regarding environmental protection drives demand for transparency and compliance.
- ESG Investing Trends: Increased investor focus on Environmental, Social, and Governance (ESG) performance compels companies to invest in robust environmental monitoring to demonstrate sustainability.
- Industrial Growth & Expansion: Growth in sectors like oil and gas, construction, and pharmaceuticals necessitates comprehensive environmental impact assessments and ongoing monitoring.
Barriers & Challenges:
- High Initial Investment Costs: Advanced monitoring equipment and software require significant capital outlay, posing a barrier for smaller businesses.
- Regulatory Complexity & Variations: Navigating diverse and evolving environmental regulations across different regions and industries can be challenging.
- Skilled Workforce Shortage: A lack of adequately trained professionals in environmental science, data analysis, and specialized monitoring techniques can hinder service delivery.
- Data Management & Interpretation: The sheer volume of data generated by monitoring systems requires sophisticated management and interpretation capabilities.
- Economic Downturns & Budget Constraints: During economic slowdowns, companies may reduce spending on non-essential environmental services, impacting market growth. Supply chain disruptions for critical components of monitoring equipment can also present challenges.
Emerging Opportunities in Environmental Analysis and Monitoring Service
Emerging opportunities in the Environmental Analysis and Monitoring Service market are significantly shaped by the global push towards sustainability and the digital transformation of industries. The growing demand for services related to carbon footprint monitoring and greenhouse gas emissions accounting presents a substantial avenue for growth, particularly with the increasing adoption of carbon capture and utilization (CCUS) technologies. The expansion of the circular economy is also creating new needs for monitoring waste streams, recycling processes, and the environmental impact of reused materials. Furthermore, the development of smart cities and the increasing deployment of smart infrastructure are driving the demand for integrated environmental monitoring systems that can provide real-time data on air quality, noise pollution, and resource consumption. The niche market for monitoring emerging contaminants, such as microplastics and persistent organic pollutants (POPs) in various environmental matrices, is also ripe for expansion as scientific understanding and regulatory attention grow.
Growth Accelerators in the Environmental Analysis and Monitoring Service Industry
The Environmental Analysis and Monitoring Service industry is experiencing accelerated growth driven by a synergy of technological breakthroughs and strategic market initiatives. The widespread adoption of AI and machine learning algorithms is significantly enhancing the predictive capabilities of environmental monitoring, allowing for proactive risk management rather than reactive responses. This includes early warning systems for potential environmental hazards and optimized resource allocation for pollution control. Strategic partnerships between technology providers and environmental service companies are fostering the development of integrated solutions that offer end-to-end environmental management capabilities, from data collection to reporting and compliance. Furthermore, the increasing global commitment to sustainable development goals (SDGs) and the growing pressure from stakeholders are compelling businesses across all sectors to invest more heavily in environmental stewardship, thus creating a sustained demand for sophisticated analysis and monitoring services. Market expansion into developing economies, where environmental regulations are evolving and industrialization is on the rise, also presents a significant growth accelerator.
Key Players Shaping the Environmental Analysis and Monitoring Service Market
- Eurofins Scientific
- ALS
- Bureau Veritas
- DNV
- Pace Analytical Services
- SGS
- AECOM
- RPS Group
- Yokogawa
- Pacific BioLabs
- DEKRA
- Perfect Pollucon Services
Notable Milestones in Environmental Analysis and Monitoring Service Sector
- 2019: Launch of advanced real-time air quality monitoring networks in major urban centers globally, enhancing public awareness and policy-making.
- 2020: Significant increase in demand for water quality monitoring services due to heightened concerns about public health and resource scarcity.
- 2021: Introduction of AI-powered predictive analytics for environmental risk assessment by leading service providers.
- 2022: Major acquisitions and mergers by key players like Eurofins Scientific and SGS to expand service portfolios and geographical reach.
- 2023: Growing adoption of IoT-enabled sensors for continuous environmental monitoring across industrial sectors.
- 2024: Increased focus on monitoring emerging contaminants like microplastics in water and soil samples.
In-Depth Environmental Analysis and Monitoring Service Market Outlook
The future of the Environmental Analysis and Monitoring Service market is exceptionally promising, fueled by an unwavering commitment to sustainability and the transformative power of technological innovation. Growth accelerators will continue to be driven by the increasing integration of AI and IoT, enabling more sophisticated predictive analytics and real-time, granular environmental data insights. Strategic partnerships will be crucial in developing comprehensive, end-to-end solutions that cater to complex industry needs, particularly in areas like carbon footprint management and circular economy initiatives. The expanding regulatory landscapes in emerging economies, coupled with a heightened global awareness of climate change impacts, will further propel market penetration. This convergence of advanced technology, regulatory drivers, and evolving stakeholder expectations positions the Environmental Analysis and Monitoring Service market for sustained and robust expansion, offering significant strategic opportunities for service providers and stakeholders alike.
Environmental Analysis and Monitoring Service Segmentation
-
1. Application
- 1.1. Industrial Monitoring
- 1.2. Construction
- 1.3. Oil and Gas
- 1.4. Pharmaceutical
- 1.5. Others
-
2. Types
- 2.1. Environmental Impact Assessment
- 2.2. Water Quality Monitoring
- 2.3. Air Quality Monitoring
- 2.4. Others
Environmental Analysis and Monitoring Service Segmentation By Geography
-
1. North America
- 1.1. United States
- 1.2. Canada
- 1.3. Mexico
-
2. South America
- 2.1. Brazil
- 2.2. Argentina
- 2.3. Rest of South America
-
3. Europe
- 3.1. United Kingdom
- 3.2. Germany
- 3.3. France
- 3.4. Italy
- 3.5. Spain
- 3.6. Russia
- 3.7. Benelux
- 3.8. Nordics
- 3.9. Rest of Europe
-
4. Middle East & Africa
- 4.1. Turkey
- 4.2. Israel
- 4.3. GCC
- 4.4. North Africa
- 4.5. South Africa
- 4.6. Rest of Middle East & Africa
-
5. Asia Pacific
- 5.1. China
- 5.2. India
- 5.3. Japan
- 5.4. South Korea
- 5.5. ASEAN
- 5.6. Oceania
- 5.7. Rest of Asia Pacific
Environmental Analysis and Monitoring Service Regional Market Share
Geographic Coverage of Environmental Analysis and Monitoring Service
Environmental Analysis and Monitoring Service REPORT HIGHLIGHTS
| Aspects | Details |
|---|---|
| Study Period | 2020-2034 |
| Base Year | 2025 |
| Estimated Year | 2026 |
| Forecast Period | 2026-2034 |
| Historical Period | 2020-2025 |
| Growth Rate | CAGR of 5.5% from 2020-2034 |
| Segmentation |
|
Table of Contents
- 1. Introduction
- 1.1. Research Scope
- 1.2. Market Segmentation
- 1.3. Research Methodology
- 1.4. Definitions and Assumptions
- 2. Executive Summary
- 2.1. Introduction
- 3. Market Dynamics
- 3.1. Introduction
- 3.2. Market Drivers
- 3.3. Market Restrains
- 3.4. Market Trends
- 4. Market Factor Analysis
- 4.1. Porters Five Forces
- 4.2. Supply/Value Chain
- 4.3. PESTEL analysis
- 4.4. Market Entropy
- 4.5. Patent/Trademark Analysis
- 5. Global Environmental Analysis and Monitoring Service Analysis, Insights and Forecast, 2020-2032
- 5.1. Market Analysis, Insights and Forecast - by Application
- 5.1.1. Industrial Monitoring
- 5.1.2. Construction
- 5.1.3. Oil and Gas
- 5.1.4. Pharmaceutical
- 5.1.5. Others
- 5.2. Market Analysis, Insights and Forecast - by Types
- 5.2.1. Environmental Impact Assessment
- 5.2.2. Water Quality Monitoring
- 5.2.3. Air Quality Monitoring
- 5.2.4. Others
- 5.3. Market Analysis, Insights and Forecast - by Region
- 5.3.1. North America
- 5.3.2. South America
- 5.3.3. Europe
- 5.3.4. Middle East & Africa
- 5.3.5. Asia Pacific
- 5.1. Market Analysis, Insights and Forecast - by Application
- 6. North America Environmental Analysis and Monitoring Service Analysis, Insights and Forecast, 2020-2032
- 6.1. Market Analysis, Insights and Forecast - by Application
- 6.1.1. Industrial Monitoring
- 6.1.2. Construction
- 6.1.3. Oil and Gas
- 6.1.4. Pharmaceutical
- 6.1.5. Others
- 6.2. Market Analysis, Insights and Forecast - by Types
- 6.2.1. Environmental Impact Assessment
- 6.2.2. Water Quality Monitoring
- 6.2.3. Air Quality Monitoring
- 6.2.4. Others
- 6.1. Market Analysis, Insights and Forecast - by Application
- 7. South America Environmental Analysis and Monitoring Service Analysis, Insights and Forecast, 2020-2032
- 7.1. Market Analysis, Insights and Forecast - by Application
- 7.1.1. Industrial Monitoring
- 7.1.2. Construction
- 7.1.3. Oil and Gas
- 7.1.4. Pharmaceutical
- 7.1.5. Others
- 7.2. Market Analysis, Insights and Forecast - by Types
- 7.2.1. Environmental Impact Assessment
- 7.2.2. Water Quality Monitoring
- 7.2.3. Air Quality Monitoring
- 7.2.4. Others
- 7.1. Market Analysis, Insights and Forecast - by Application
- 8. Europe Environmental Analysis and Monitoring Service Analysis, Insights and Forecast, 2020-2032
- 8.1. Market Analysis, Insights and Forecast - by Application
- 8.1.1. Industrial Monitoring
- 8.1.2. Construction
- 8.1.3. Oil and Gas
- 8.1.4. Pharmaceutical
- 8.1.5. Others
- 8.2. Market Analysis, Insights and Forecast - by Types
- 8.2.1. Environmental Impact Assessment
- 8.2.2. Water Quality Monitoring
- 8.2.3. Air Quality Monitoring
- 8.2.4. Others
- 8.1. Market Analysis, Insights and Forecast - by Application
- 9. Middle East & Africa Environmental Analysis and Monitoring Service Analysis, Insights and Forecast, 2020-2032
- 9.1. Market Analysis, Insights and Forecast - by Application
- 9.1.1. Industrial Monitoring
- 9.1.2. Construction
- 9.1.3. Oil and Gas
- 9.1.4. Pharmaceutical
- 9.1.5. Others
- 9.2. Market Analysis, Insights and Forecast - by Types
- 9.2.1. Environmental Impact Assessment
- 9.2.2. Water Quality Monitoring
- 9.2.3. Air Quality Monitoring
- 9.2.4. Others
- 9.1. Market Analysis, Insights and Forecast - by Application
- 10. Asia Pacific Environmental Analysis and Monitoring Service Analysis, Insights and Forecast, 2020-2032
- 10.1. Market Analysis, Insights and Forecast - by Application
- 10.1.1. Industrial Monitoring
- 10.1.2. Construction
- 10.1.3. Oil and Gas
- 10.1.4. Pharmaceutical
- 10.1.5. Others
- 10.2. Market Analysis, Insights and Forecast - by Types
- 10.2.1. Environmental Impact Assessment
- 10.2.2. Water Quality Monitoring
- 10.2.3. Air Quality Monitoring
- 10.2.4. Others
- 10.1. Market Analysis, Insights and Forecast - by Application
- 11. Competitive Analysis
- 11.1. Global Market Share Analysis 2025
- 11.2. Company Profiles
- 11.2.1 Eurofins Scientific
- 11.2.1.1. Overview
- 11.2.1.2. Products
- 11.2.1.3. SWOT Analysis
- 11.2.1.4. Recent Developments
- 11.2.1.5. Financials (Based on Availability)
- 11.2.2 ALS
- 11.2.2.1. Overview
- 11.2.2.2. Products
- 11.2.2.3. SWOT Analysis
- 11.2.2.4. Recent Developments
- 11.2.2.5. Financials (Based on Availability)
- 11.2.3 Bureau Veritas
- 11.2.3.1. Overview
- 11.2.3.2. Products
- 11.2.3.3. SWOT Analysis
- 11.2.3.4. Recent Developments
- 11.2.3.5. Financials (Based on Availability)
- 11.2.4 DNV
- 11.2.4.1. Overview
- 11.2.4.2. Products
- 11.2.4.3. SWOT Analysis
- 11.2.4.4. Recent Developments
- 11.2.4.5. Financials (Based on Availability)
- 11.2.5 Pace Analytical Services
- 11.2.5.1. Overview
- 11.2.5.2. Products
- 11.2.5.3. SWOT Analysis
- 11.2.5.4. Recent Developments
- 11.2.5.5. Financials (Based on Availability)
- 11.2.6 SGS
- 11.2.6.1. Overview
- 11.2.6.2. Products
- 11.2.6.3. SWOT Analysis
- 11.2.6.4. Recent Developments
- 11.2.6.5. Financials (Based on Availability)
- 11.2.7 AECOM
- 11.2.7.1. Overview
- 11.2.7.2. Products
- 11.2.7.3. SWOT Analysis
- 11.2.7.4. Recent Developments
- 11.2.7.5. Financials (Based on Availability)
- 11.2.8 RPS Group
- 11.2.8.1. Overview
- 11.2.8.2. Products
- 11.2.8.3. SWOT Analysis
- 11.2.8.4. Recent Developments
- 11.2.8.5. Financials (Based on Availability)
- 11.2.9 Yokogawa
- 11.2.9.1. Overview
- 11.2.9.2. Products
- 11.2.9.3. SWOT Analysis
- 11.2.9.4. Recent Developments
- 11.2.9.5. Financials (Based on Availability)
- 11.2.10 Pacific BioLabs
- 11.2.10.1. Overview
- 11.2.10.2. Products
- 11.2.10.3. SWOT Analysis
- 11.2.10.4. Recent Developments
- 11.2.10.5. Financials (Based on Availability)
- 11.2.11 DEKRA
- 11.2.11.1. Overview
- 11.2.11.2. Products
- 11.2.11.3. SWOT Analysis
- 11.2.11.4. Recent Developments
- 11.2.11.5. Financials (Based on Availability)
- 11.2.12 Perfect Pollucon Services
- 11.2.12.1. Overview
- 11.2.12.2. Products
- 11.2.12.3. SWOT Analysis
- 11.2.12.4. Recent Developments
- 11.2.12.5. Financials (Based on Availability)
- 11.2.1 Eurofins Scientific
List of Figures
- Figure 1: Global Environmental Analysis and Monitoring Service Revenue Breakdown (undefined, %) by Region 2025 & 2033
- Figure 2: North America Environmental Analysis and Monitoring Service Revenue (undefined), by Application 2025 & 2033
- Figure 3: North America Environmental Analysis and Monitoring Service Revenue Share (%), by Application 2025 & 2033
- Figure 4: North America Environmental Analysis and Monitoring Service Revenue (undefined), by Types 2025 & 2033
- Figure 5: North America Environmental Analysis and Monitoring Service Revenue Share (%), by Types 2025 & 2033
- Figure 6: North America Environmental Analysis and Monitoring Service Revenue (undefined), by Country 2025 & 2033
- Figure 7: North America Environmental Analysis and Monitoring Service Revenue Share (%), by Country 2025 & 2033
- Figure 8: South America Environmental Analysis and Monitoring Service Revenue (undefined), by Application 2025 & 2033
- Figure 9: South America Environmental Analysis and Monitoring Service Revenue Share (%), by Application 2025 & 2033
- Figure 10: South America Environmental Analysis and Monitoring Service Revenue (undefined), by Types 2025 & 2033
- Figure 11: South America Environmental Analysis and Monitoring Service Revenue Share (%), by Types 2025 & 2033
- Figure 12: South America Environmental Analysis and Monitoring Service Revenue (undefined), by Country 2025 & 2033
- Figure 13: South America Environmental Analysis and Monitoring Service Revenue Share (%), by Country 2025 & 2033
- Figure 14: Europe Environmental Analysis and Monitoring Service Revenue (undefined), by Application 2025 & 2033
- Figure 15: Europe Environmental Analysis and Monitoring Service Revenue Share (%), by Application 2025 & 2033
- Figure 16: Europe Environmental Analysis and Monitoring Service Revenue (undefined), by Types 2025 & 2033
- Figure 17: Europe Environmental Analysis and Monitoring Service Revenue Share (%), by Types 2025 & 2033
- Figure 18: Europe Environmental Analysis and Monitoring Service Revenue (undefined), by Country 2025 & 2033
- Figure 19: Europe Environmental Analysis and Monitoring Service Revenue Share (%), by Country 2025 & 2033
- Figure 20: Middle East & Africa Environmental Analysis and Monitoring Service Revenue (undefined), by Application 2025 & 2033
- Figure 21: Middle East & Africa Environmental Analysis and Monitoring Service Revenue Share (%), by Application 2025 & 2033
- Figure 22: Middle East & Africa Environmental Analysis and Monitoring Service Revenue (undefined), by Types 2025 & 2033
- Figure 23: Middle East & Africa Environmental Analysis and Monitoring Service Revenue Share (%), by Types 2025 & 2033
- Figure 24: Middle East & Africa Environmental Analysis and Monitoring Service Revenue (undefined), by Country 2025 & 2033
- Figure 25: Middle East & Africa Environmental Analysis and Monitoring Service Revenue Share (%), by Country 2025 & 2033
- Figure 26: Asia Pacific Environmental Analysis and Monitoring Service Revenue (undefined), by Application 2025 & 2033
- Figure 27: Asia Pacific Environmental Analysis and Monitoring Service Revenue Share (%), by Application 2025 & 2033
- Figure 28: Asia Pacific Environmental Analysis and Monitoring Service Revenue (undefined), by Types 2025 & 2033
- Figure 29: Asia Pacific Environmental Analysis and Monitoring Service Revenue Share (%), by Types 2025 & 2033
- Figure 30: Asia Pacific Environmental Analysis and Monitoring Service Revenue (undefined), by Country 2025 & 2033
- Figure 31: Asia Pacific Environmental Analysis and Monitoring Service Revenue Share (%), by Country 2025 & 2033
List of Tables
- Table 1: Global Environmental Analysis and Monitoring Service Revenue undefined Forecast, by Application 2020 & 2033
- Table 2: Global Environmental Analysis and Monitoring Service Revenue undefined Forecast, by Types 2020 & 2033
- Table 3: Global Environmental Analysis and Monitoring Service Revenue undefined Forecast, by Region 2020 & 2033
- Table 4: Global Environmental Analysis and Monitoring Service Revenue undefined Forecast, by Application 2020 & 2033
- Table 5: Global Environmental Analysis and Monitoring Service Revenue undefined Forecast, by Types 2020 & 2033
- Table 6: Global Environmental Analysis and Monitoring Service Revenue undefined Forecast, by Country 2020 & 2033
- Table 7: United States Environmental Analysis and Monitoring Service Revenue (undefined) Forecast, by Application 2020 & 2033
- Table 8: Canada Environmental Analysis and Monitoring Service Revenue (undefined) Forecast, by Application 2020 & 2033
- Table 9: Mexico Environmental Analysis and Monitoring Service Revenue (undefined) Forecast, by Application 2020 & 2033
- Table 10: Global Environmental Analysis and Monitoring Service Revenue undefined Forecast, by Application 2020 & 2033
- Table 11: Global Environmental Analysis and Monitoring Service Revenue undefined Forecast, by Types 2020 & 2033
- Table 12: Global Environmental Analysis and Monitoring Service Revenue undefined Forecast, by Country 2020 & 2033
- Table 13: Brazil Environmental Analysis and Monitoring Service Revenue (undefined) Forecast, by Application 2020 & 2033
- Table 14: Argentina Environmental Analysis and Monitoring Service Revenue (undefined) Forecast, by Application 2020 & 2033
- Table 15: Rest of South America Environmental Analysis and Monitoring Service Revenue (undefined) Forecast, by Application 2020 & 2033
- Table 16: Global Environmental Analysis and Monitoring Service Revenue undefined Forecast, by Application 2020 & 2033
- Table 17: Global Environmental Analysis and Monitoring Service Revenue undefined Forecast, by Types 2020 & 2033
- Table 18: Global Environmental Analysis and Monitoring Service Revenue undefined Forecast, by Country 2020 & 2033
- Table 19: United Kingdom Environmental Analysis and Monitoring Service Revenue (undefined) Forecast, by Application 2020 & 2033
- Table 20: Germany Environmental Analysis and Monitoring Service Revenue (undefined) Forecast, by Application 2020 & 2033
- Table 21: France Environmental Analysis and Monitoring Service Revenue (undefined) Forecast, by Application 2020 & 2033
- Table 22: Italy Environmental Analysis and Monitoring Service Revenue (undefined) Forecast, by Application 2020 & 2033
- Table 23: Spain Environmental Analysis and Monitoring Service Revenue (undefined) Forecast, by Application 2020 & 2033
- Table 24: Russia Environmental Analysis and Monitoring Service Revenue (undefined) Forecast, by Application 2020 & 2033
- Table 25: Benelux Environmental Analysis and Monitoring Service Revenue (undefined) Forecast, by Application 2020 & 2033
- Table 26: Nordics Environmental Analysis and Monitoring Service Revenue (undefined) Forecast, by Application 2020 & 2033
- Table 27: Rest of Europe Environmental Analysis and Monitoring Service Revenue (undefined) Forecast, by Application 2020 & 2033
- Table 28: Global Environmental Analysis and Monitoring Service Revenue undefined Forecast, by Application 2020 & 2033
- Table 29: Global Environmental Analysis and Monitoring Service Revenue undefined Forecast, by Types 2020 & 2033
- Table 30: Global Environmental Analysis and Monitoring Service Revenue undefined Forecast, by Country 2020 & 2033
- Table 31: Turkey Environmental Analysis and Monitoring Service Revenue (undefined) Forecast, by Application 2020 & 2033
- Table 32: Israel Environmental Analysis and Monitoring Service Revenue (undefined) Forecast, by Application 2020 & 2033
- Table 33: GCC Environmental Analysis and Monitoring Service Revenue (undefined) Forecast, by Application 2020 & 2033
- Table 34: North Africa Environmental Analysis and Monitoring Service Revenue (undefined) Forecast, by Application 2020 & 2033
- Table 35: South Africa Environmental Analysis and Monitoring Service Revenue (undefined) Forecast, by Application 2020 & 2033
- Table 36: Rest of Middle East & Africa Environmental Analysis and Monitoring Service Revenue (undefined) Forecast, by Application 2020 & 2033
- Table 37: Global Environmental Analysis and Monitoring Service Revenue undefined Forecast, by Application 2020 & 2033
- Table 38: Global Environmental Analysis and Monitoring Service Revenue undefined Forecast, by Types 2020 & 2033
- Table 39: Global Environmental Analysis and Monitoring Service Revenue undefined Forecast, by Country 2020 & 2033
- Table 40: China Environmental Analysis and Monitoring Service Revenue (undefined) Forecast, by Application 2020 & 2033
- Table 41: India Environmental Analysis and Monitoring Service Revenue (undefined) Forecast, by Application 2020 & 2033
- Table 42: Japan Environmental Analysis and Monitoring Service Revenue (undefined) Forecast, by Application 2020 & 2033
- Table 43: South Korea Environmental Analysis and Monitoring Service Revenue (undefined) Forecast, by Application 2020 & 2033
- Table 44: ASEAN Environmental Analysis and Monitoring Service Revenue (undefined) Forecast, by Application 2020 & 2033
- Table 45: Oceania Environmental Analysis and Monitoring Service Revenue (undefined) Forecast, by Application 2020 & 2033
- Table 46: Rest of Asia Pacific Environmental Analysis and Monitoring Service Revenue (undefined) Forecast, by Application 2020 & 2033
Frequently Asked Questions
1. What is the projected Compound Annual Growth Rate (CAGR) of the Environmental Analysis and Monitoring Service?
The projected CAGR is approximately 5.5%.
2. Which companies are prominent players in the Environmental Analysis and Monitoring Service?
Key companies in the market include Eurofins Scientific, ALS, Bureau Veritas, DNV, Pace Analytical Services, SGS, AECOM, RPS Group, Yokogawa, Pacific BioLabs, DEKRA, Perfect Pollucon Services.
3. What are the main segments of the Environmental Analysis and Monitoring Service?
The market segments include Application, Types.
4. Can you provide details about the market size?
The market size is estimated to be USD XXX N/A as of 2022.
5. What are some drivers contributing to market growth?
N/A
6. What are the notable trends driving market growth?
N/A
7. Are there any restraints impacting market growth?
N/A
8. Can you provide examples of recent developments in the market?
N/A
9. What pricing options are available for accessing the report?
Pricing options include single-user, multi-user, and enterprise licenses priced at USD 4900.00, USD 7350.00, and USD 9800.00 respectively.
10. Is the market size provided in terms of value or volume?
The market size is provided in terms of value, measured in N/A.
11. Are there any specific market keywords associated with the report?
Yes, the market keyword associated with the report is "Environmental Analysis and Monitoring Service," which aids in identifying and referencing the specific market segment covered.
12. How do I determine which pricing option suits my needs best?
The pricing options vary based on user requirements and access needs. Individual users may opt for single-user licenses, while businesses requiring broader access may choose multi-user or enterprise licenses for cost-effective access to the report.
13. Are there any additional resources or data provided in the Environmental Analysis and Monitoring Service report?
While the report offers comprehensive insights, it's advisable to review the specific contents or supplementary materials provided to ascertain if additional resources or data are available.
14. How can I stay updated on further developments or reports in the Environmental Analysis and Monitoring Service?
To stay informed about further developments, trends, and reports in the Environmental Analysis and Monitoring Service, consider subscribing to industry newsletters, following relevant companies and organizations, or regularly checking reputable industry news sources and publications.
Methodology
Step 1 - Identification of Relevant Samples Size from Population Database


Step 2 - Approaches for Defining Global Market Size (Value, Volume* & Price*)

Note*: In applicable scenarios
Step 3 - Data Sources
Primary Research
- Web Analytics
- Survey Reports
- Research Institute
- Latest Research Reports
- Opinion Leaders
Secondary Research
- Annual Reports
- White Paper
- Latest Press Release
- Industry Association
- Paid Database
- Investor Presentations

Step 4 - Data Triangulation
Involves using different sources of information in order to increase the validity of a study
These sources are likely to be stakeholders in a program - participants, other researchers, program staff, other community members, and so on.
Then we put all data in single framework & apply various statistical tools to find out the dynamic on the market.
During the analysis stage, feedback from the stakeholder groups would be compared to determine areas of agreement as well as areas of divergence