

Key Insights
The global Industrial Edge Computing Gateway market is poised for remarkable expansion, projected to reach an impressive $18.3 billion in 2024. This rapid growth is propelled by a phenomenal Compound Annual Growth Rate (CAGR) of 22.4% throughout the forecast period. The proliferation of Industry 4.0 initiatives, coupled with the escalating demand for real-time data processing at the source, are the primary catalysts driving this surge. Organizations are increasingly recognizing the strategic imperative of leveraging edge computing to enhance operational efficiency, reduce latency, and enable advanced analytics for predictive maintenance, remote monitoring, and intelligent automation across various industrial sectors. The inherent need to process vast amounts of data generated by an ever-increasing number of connected devices directly on-site, rather than transmitting it all to a centralized cloud, underpins the critical role of industrial edge gateways in modern manufacturing, energy management, and transportation networks.
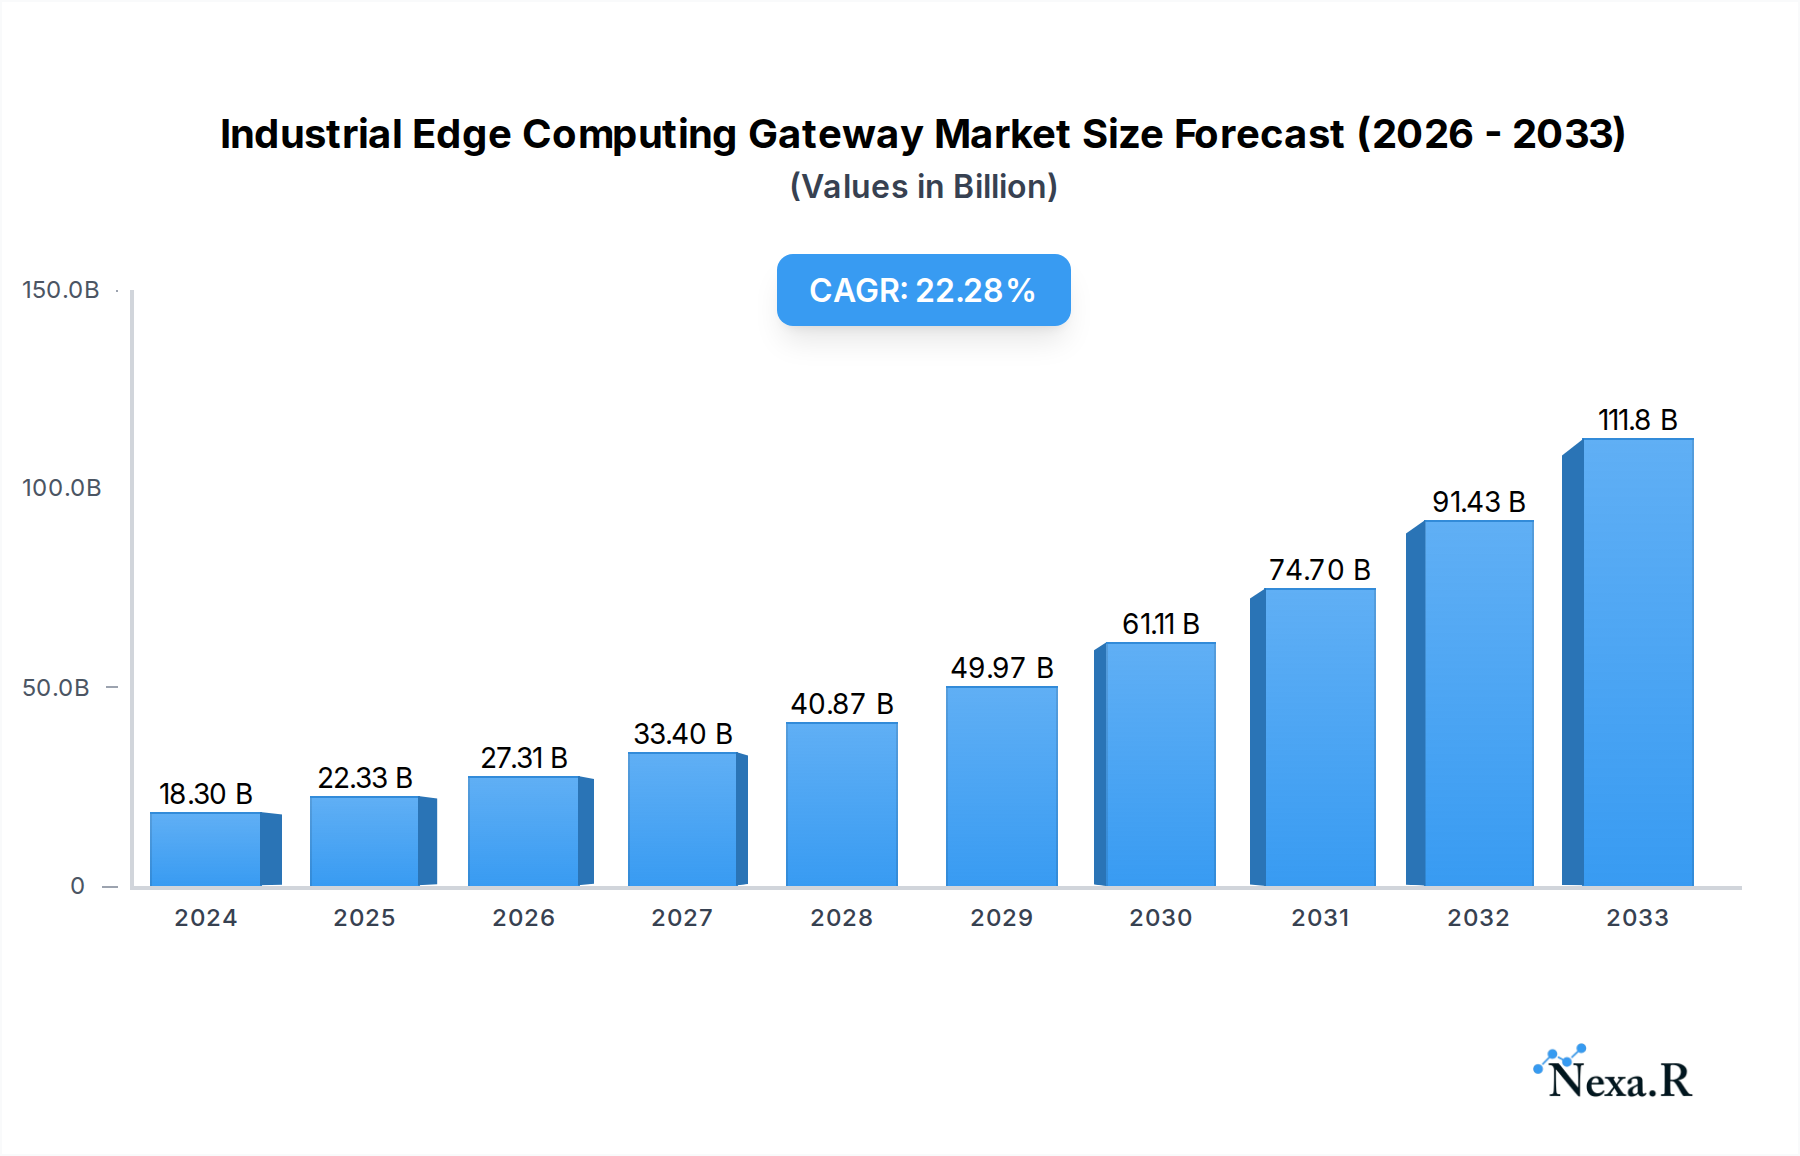
Industrial Edge Computing Gateway Market Size (In Billion)
Key drivers underpinning this robust market trajectory include the transformative impact of AI and machine learning deployments at the edge, leading to more intelligent and autonomous industrial operations. The continuous evolution of IoT technologies and the widespread adoption of smart sensors are further amplifying data generation, necessitating sophisticated edge gateway solutions for effective data aggregation, filtering, and local processing. While the market benefits from these powerful trends, potential restraints such as cybersecurity concerns and the complexity of integrating edge solutions with legacy systems require careful consideration and strategic mitigation. The market is segmented by application, with Manufacturing and Energy & Electricity expected to dominate, and by type, with Embedded and Wall-mounted gateways leading the adoption. Leading companies like DELL, HPE, Cisco, Huawei, and ABB are at the forefront, innovating to meet the evolving demands of this dynamic landscape across major regions.

Industrial Edge Computing Gateway Company Market Share
Industrial Edge Computing Gateway Market: Comprehensive Report Description
Unlock the future of industrial operations with our in-depth analysis of the Industrial Edge Computing Gateway market. This report provides critical insights into market dynamics, growth trends, regional dominance, product innovation, and key players shaping this rapidly evolving sector. Discover how edge computing is revolutionizing manufacturing, energy, transportation, and beyond, driving efficiency, security, and real-time decision-making.
Industrial Edge Computing Gateway Market Dynamics & Structure
The Industrial Edge Computing Gateway market is characterized by a moderate to high level of concentration, with a few dominant players alongside a growing number of specialized vendors. Technological innovation is the primary driver, fueled by the increasing demand for real-time data processing at the source to reduce latency, enhance security, and enable advanced analytics for Industrial IoT (IIoT) applications. Regulatory frameworks, particularly concerning data privacy and cybersecurity in critical infrastructure, are also influencing gateway design and deployment strategies. Competitive product substitutes include traditional cloud-based solutions and on-premise servers, but the distinct advantages of edge processing in terms of speed and autonomy are creating a clear market niche. End-user demographics are diverse, spanning large enterprises in manufacturing and energy to medium-sized businesses in logistics and smart cities. Mergers and acquisitions (M&A) are a significant trend, with larger technology providers acquiring specialized edge companies to expand their portfolios and market reach. For instance, the past three years have seen an estimated $1.5 billion in M&A deals within this segment, consolidating expertise and accelerating product development.
- Market Concentration: Dominated by a mix of established industrial automation giants and emerging IIoT specialists.
- Technological Innovation Drivers: Real-time data processing, AI/ML at the edge, enhanced cybersecurity, and the proliferation of IIoT devices.
- Regulatory Frameworks: Growing emphasis on data localization, industry-specific security standards, and operational technology (OT) convergence.
- Competitive Product Substitutes: Cloud computing platforms, on-premise servers, and specialized industrial gateways with limited processing capabilities.
- End-User Demographics: Manufacturing (45%), Energy and Electricity (30%), Transportation (15%), Others (10%).
- M&A Trends: Increasing consolidation as larger players seek to integrate edge capabilities into their broader IIoT offerings.
Industrial Edge Computing Gateway Growth Trends & Insights
The Industrial Edge Computing Gateway market is poised for substantial growth, projected to reach an estimated $25.6 billion by 2033, with a Compound Annual Growth Rate (CAGR) of 22.5% during the forecast period of 2025–2033. This expansion is driven by the critical need for localized data processing and intelligent decision-making in industries characterized by vast, distributed operational technology (OT) environments. The base year of 2025 marks a pivotal point, with an estimated market size of $8.9 billion, reflecting the accelerating adoption of Industry 4.0 principles and the increasing complexity of industrial automation systems. The study period from 2019–2024 witnessed foundational growth, laying the groundwork for the current surge. Technological disruptions, such as the miniaturization of powerful processors, advancements in AI/ML algorithms that can be deployed at the edge, and the development of robust, ruggedized hardware, are directly contributing to higher adoption rates. Consumer behavior shifts within industrial settings are also a key factor; plant managers and operational decision-makers are increasingly prioritizing solutions that offer immediate insights and control, minimizing reliance on remote cloud infrastructure for time-sensitive tasks. This has led to a significant increase in the deployment of embedded and wall-mounted edge gateways, which offer discreet integration and tailored functionality for specific industrial applications. Market penetration is steadily increasing, particularly in sectors like manufacturing where predictive maintenance and real-time quality control are paramount. The historical growth from 2019–2024, estimated at a CAGR of 19.8%, underscores the escalating demand and the growing recognition of edge computing's indispensable role in modern industrial operations. The estimated year of 2025 represents a key inflection point, where the market transitions from early adoption to widespread integration.
Dominant Regions, Countries, or Segments in Industrial Edge Computing Gateway
The Manufacturing segment, encompassing sectors from discrete manufacturing to process industries, stands as the dominant force in the Industrial Edge Computing Gateway market, projected to account for approximately 45% of the total market share by 2033. This dominance is fueled by the relentless pursuit of operational efficiency, automation, and the implementation of Industry 4.0 initiatives. Key drivers within this segment include the need for real-time machine monitoring, predictive maintenance, quality control, and supply chain optimization. Countries within North America and Europe, such as the United States and Germany, are leading the charge due to strong industrial bases, advanced technological infrastructure, and significant government support for digital transformation.
The Energy and Electricity sector is a close second, representing around 30% of the market. This segment's growth is driven by the digitization of smart grids, renewable energy integration, and the increasing demand for remote monitoring and control of energy infrastructure for enhanced reliability and security. Countries with large-scale energy production and distribution networks, like China and the United States, are key contributors to this segment's growth.
The Transportation segment, accounting for about 15%, is witnessing rapid adoption driven by the need for connected vehicle solutions, intelligent traffic management systems, and logistics optimization. Emerging economies in Asia and Latin America are showing significant growth potential in this area. The "Others" segment, including healthcare, smart cities, and retail, constitutes the remaining 10% but is rapidly expanding with innovative edge applications.
In terms of gateway Types, Embedded gateways are gaining significant traction due to their seamless integration into machinery and equipment, offering tailored processing power and connectivity. Wall-mounted gateways are also crucial for providing centralized data aggregation and control points within factory floors or substations. The dominance of manufacturing and the need for integrated solutions are directly driving the preference for embedded and wall-mounted form factors. The market's growth potential in these dominant segments is further amplified by economic policies promoting industrial modernization and the continuous expansion of IIoT connectivity.
Industrial Edge Computing Gateway Product Landscape
The Industrial Edge Computing Gateway product landscape is characterized by increasing ruggedization, enhanced processing power, and advanced connectivity options. Vendors are differentiating their offerings with specialized hardware designed to withstand harsh industrial environments, including extreme temperatures, vibrations, and dust. Innovations focus on integrating powerful edge AI/ML capabilities for on-device inferencing, reducing latency for critical applications like real-time anomaly detection and predictive maintenance. Enhanced cybersecurity features, such as hardware-based encryption and secure boot mechanisms, are becoming standard. Connectivity options are expanding to include multiple industrial protocols (e.g., Modbus, Profinet, EtherNet/IP), 5G, and Wi-Fi 6 for greater flexibility and faster data transfer. Unique selling propositions include modular designs for scalability, extended operating temperature ranges, and certifications for specific industry standards.
Key Drivers, Barriers & Challenges in Industrial Edge Computing Gateway
Key Drivers: The primary forces propelling the Industrial Edge Computing Gateway market include the escalating demand for real-time data analytics and control in IIoT environments, the need to reduce operational costs through predictive maintenance and automation, and the growing imperative for enhanced cybersecurity and data privacy at the source. The proliferation of connected industrial devices and the ongoing digital transformation initiatives across various sectors, particularly manufacturing and energy, are also significant growth accelerators.
Key Barriers & Challenges: Key challenges include the initial cost of deployment and integration, the complexity of managing distributed edge devices, and the shortage of skilled personnel capable of designing, deploying, and maintaining edge computing solutions. Supply chain disruptions for specialized components and regulatory hurdles related to data governance and international standards can also pose significant restraints. Competitive pressures from established cloud providers offering hybrid solutions and the inherent resistance to change within traditional industrial settings also present obstacles to widespread adoption. The estimated impact of supply chain issues on project timelines is currently around 15-20%.
Emerging Opportunities in Industrial Edge Computing Gateway
Emerging opportunities lie in the expansion of edge AI and machine learning for advanced anomaly detection, autonomous operations, and predictive quality control in real-time. The increasing adoption of 5G technology presents a significant opportunity for low-latency, high-bandwidth edge solutions in areas like autonomous robotics and remote operations. Untapped markets in developing economies with growing industrial bases, particularly in sectors like smart agriculture and intelligent logistics, offer substantial growth potential. Evolving consumer preferences for sustainable and efficient manufacturing processes are also driving the demand for edge-enabled solutions that optimize resource utilization and reduce environmental impact. The integration of edge computing with digital twins is another promising avenue for enhanced simulation and operational management.
Growth Accelerators in the Industrial Edge Computing Gateway Industry
Catalysts driving long-term growth in the Industrial Edge Computing Gateway industry are rooted in continued technological breakthroughs in processing power and AI capabilities, enabling more sophisticated on-device intelligence. Strategic partnerships between hardware manufacturers, software developers, and system integrators are crucial for delivering end-to-end edge solutions. Market expansion strategies focused on addressing the unique needs of specific industry verticals, such as smart grid management in the energy sector or autonomous systems in manufacturing, are key. Furthermore, the development of open-source edge platforms and standardized protocols will lower barriers to entry and foster greater ecosystem collaboration, accelerating adoption and innovation across the board.
Key Players Shaping the Industrial Edge Computing Gateway Market
- DELL
- HPE
- Cisco
- Huawei
- ABB
- Advantech
- Fujitsu
- Eurotech
- Sierra Wireless
- AAEON
- Hirschmann
- ADLINK Technology
- Digi International
- Beijing InHand Networks Technology
Notable Milestones in Industrial Edge Computing Gateway Sector
- 2020 Q3: Advantech launches its new range of industrial edge AI computing solutions, enhancing on-device processing for manufacturing automation.
- 2021 Q1: Cisco introduces its Edge Intelligence platform, simplifying data collection and analytics for industrial IoT deployments.
- 2021 Q4: Dell Technologies announces advancements in its edge computing portfolio, focusing on ruggedized solutions for harsh industrial environments.
- 2022 Q2: Huawei expands its edge computing offerings with enhanced connectivity and security features for energy and transportation sectors.
- 2022 Q3: ABB integrates advanced edge analytics into its industrial automation platforms, enabling real-time performance monitoring and optimization.
- 2023 Q1: Sierra Wireless unveils new IoT gateways with integrated 5G capabilities for ultra-low latency industrial applications.
- 2023 Q4: Eurotech introduces a new generation of edge computers optimized for AI inference at the edge in smart manufacturing.
- 2024 Q2: ADLINK Technology collaborates with AI software providers to accelerate the deployment of edge AI solutions in industrial settings.
In-Depth Industrial Edge Computing Gateway Market Outlook
The future of the Industrial Edge Computing Gateway market is exceptionally promising, driven by an unceasing demand for localized intelligence and operational resilience. Growth accelerators will be significantly influenced by the continued miniaturization of powerful computing components, enabling more potent and versatile edge devices. The widespread adoption of 5G infrastructure will unlock new levels of real-time data processing and remote control, particularly in autonomous systems and critical infrastructure management. Strategic alliances between hardware, software, and telecommunications providers will be instrumental in creating comprehensive, end-to-end edge solutions. Focus will increasingly shift towards industry-specific applications, addressing unique challenges in sectors like smart energy grids, intelligent transportation networks, and advanced manufacturing processes. The market's trajectory points towards a future where edge computing is not just an add-on, but an integral foundation of all smart industrial operations.
Industrial Edge Computing Gateway Segmentation
-
1. Application
- 1.1. Manufacturing
- 1.2. Energy and Electricity
- 1.3. Transportation
- 1.4. Others
-
2. Types
- 2.1. Embedded
- 2.2. Wall-mounted
- 2.3. Others
Industrial Edge Computing Gateway Segmentation By Geography
-
1. North America
- 1.1. United States
- 1.2. Canada
- 1.3. Mexico
-
2. South America
- 2.1. Brazil
- 2.2. Argentina
- 2.3. Rest of South America
-
3. Europe
- 3.1. United Kingdom
- 3.2. Germany
- 3.3. France
- 3.4. Italy
- 3.5. Spain
- 3.6. Russia
- 3.7. Benelux
- 3.8. Nordics
- 3.9. Rest of Europe
-
4. Middle East & Africa
- 4.1. Turkey
- 4.2. Israel
- 4.3. GCC
- 4.4. North Africa
- 4.5. South Africa
- 4.6. Rest of Middle East & Africa
-
5. Asia Pacific
- 5.1. China
- 5.2. India
- 5.3. Japan
- 5.4. South Korea
- 5.5. ASEAN
- 5.6. Oceania
- 5.7. Rest of Asia Pacific
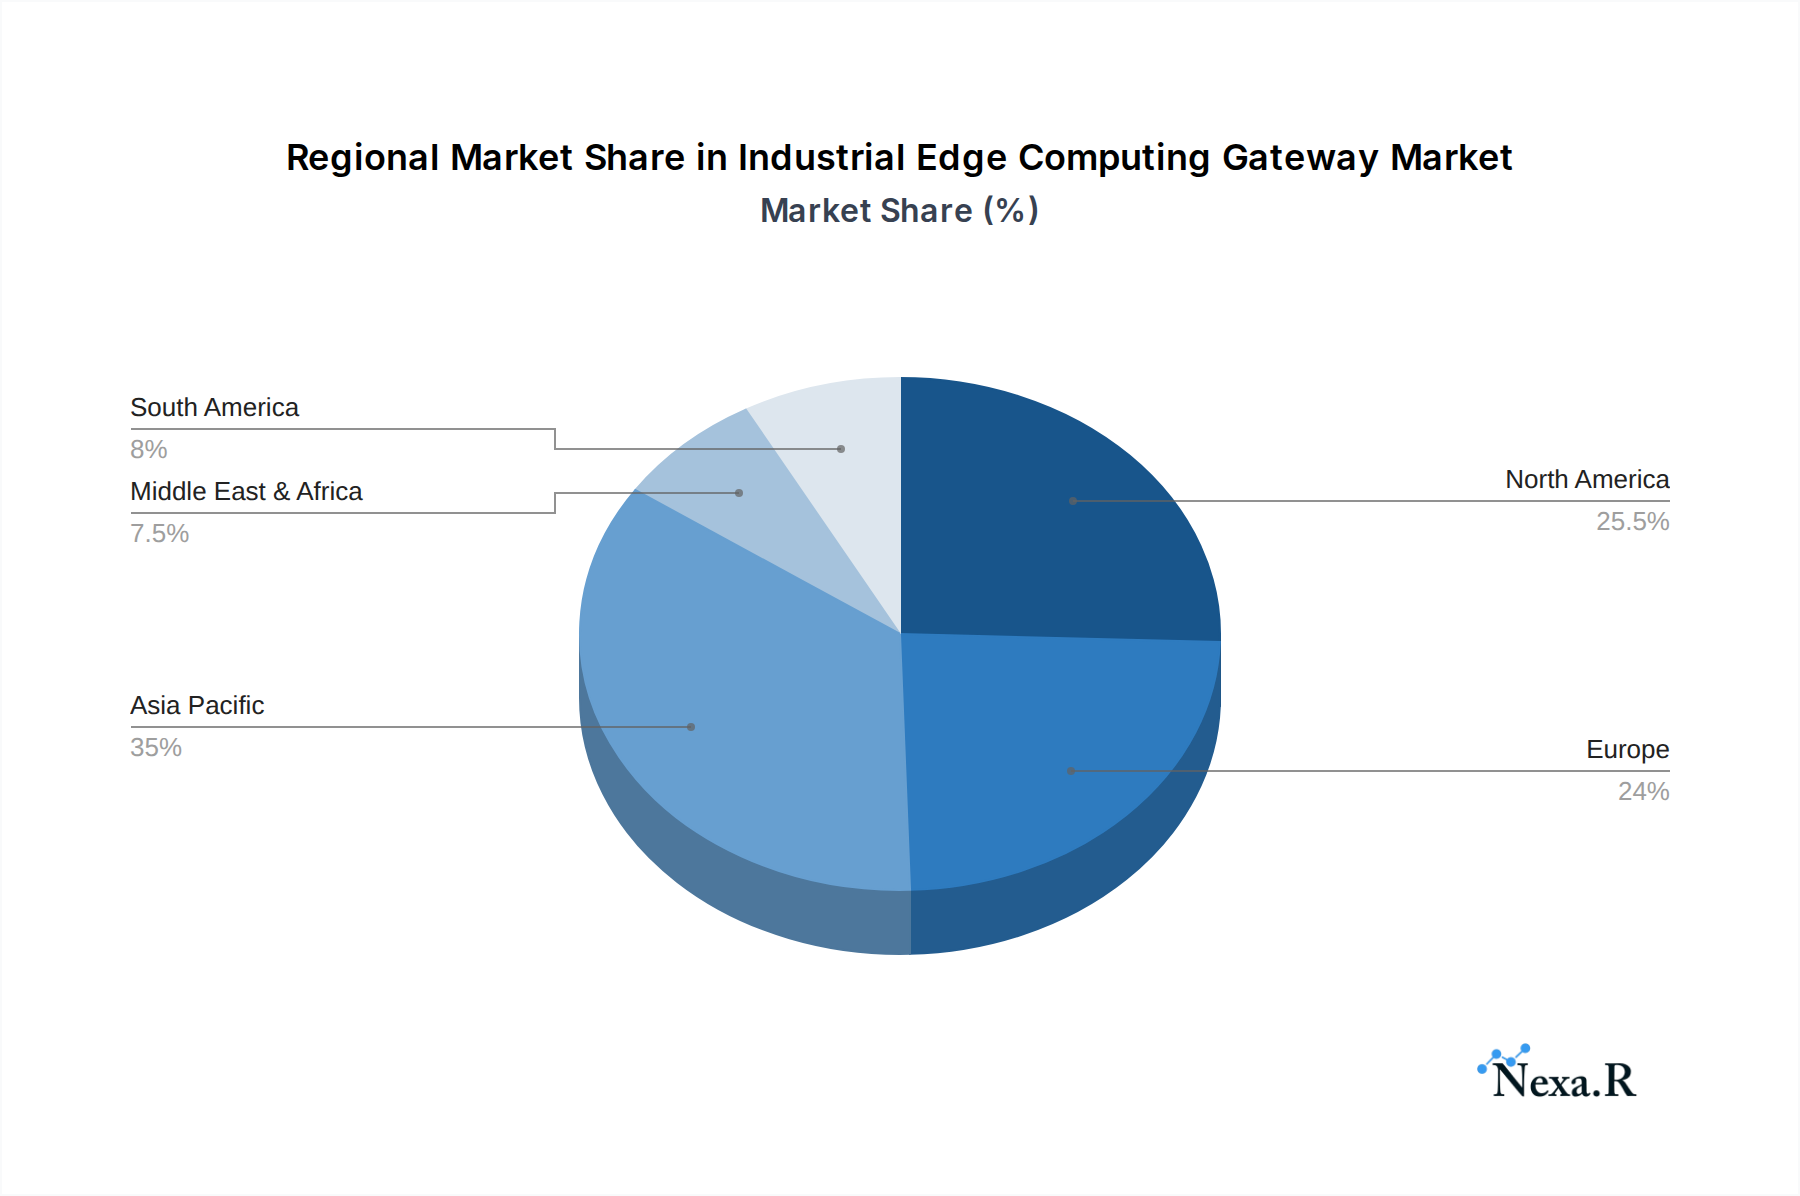
Industrial Edge Computing Gateway Regional Market Share
Geographic Coverage of Industrial Edge Computing Gateway
Industrial Edge Computing Gateway REPORT HIGHLIGHTS
| Aspects | Details |
|---|---|
| Study Period | 2020-2034 |
| Base Year | 2025 |
| Estimated Year | 2026 |
| Forecast Period | 2026-2034 |
| Historical Period | 2020-2025 |
| Growth Rate | CAGR of 22.4% from 2020-2034 |
| Segmentation |
|
Table of Contents
- 1. Introduction
- 1.1. Research Scope
- 1.2. Market Segmentation
- 1.3. Research Methodology
- 1.4. Definitions and Assumptions
- 2. Executive Summary
- 2.1. Introduction
- 3. Market Dynamics
- 3.1. Introduction
- 3.2. Market Drivers
- 3.3. Market Restrains
- 3.4. Market Trends
- 4. Market Factor Analysis
- 4.1. Porters Five Forces
- 4.2. Supply/Value Chain
- 4.3. PESTEL analysis
- 4.4. Market Entropy
- 4.5. Patent/Trademark Analysis
- 5. Global Industrial Edge Computing Gateway Analysis, Insights and Forecast, 2020-2032
- 5.1. Market Analysis, Insights and Forecast - by Application
- 5.1.1. Manufacturing
- 5.1.2. Energy and Electricity
- 5.1.3. Transportation
- 5.1.4. Others
- 5.2. Market Analysis, Insights and Forecast - by Types
- 5.2.1. Embedded
- 5.2.2. Wall-mounted
- 5.2.3. Others
- 5.3. Market Analysis, Insights and Forecast - by Region
- 5.3.1. North America
- 5.3.2. South America
- 5.3.3. Europe
- 5.3.4. Middle East & Africa
- 5.3.5. Asia Pacific
- 5.1. Market Analysis, Insights and Forecast - by Application
- 6. North America Industrial Edge Computing Gateway Analysis, Insights and Forecast, 2020-2032
- 6.1. Market Analysis, Insights and Forecast - by Application
- 6.1.1. Manufacturing
- 6.1.2. Energy and Electricity
- 6.1.3. Transportation
- 6.1.4. Others
- 6.2. Market Analysis, Insights and Forecast - by Types
- 6.2.1. Embedded
- 6.2.2. Wall-mounted
- 6.2.3. Others
- 6.1. Market Analysis, Insights and Forecast - by Application
- 7. South America Industrial Edge Computing Gateway Analysis, Insights and Forecast, 2020-2032
- 7.1. Market Analysis, Insights and Forecast - by Application
- 7.1.1. Manufacturing
- 7.1.2. Energy and Electricity
- 7.1.3. Transportation
- 7.1.4. Others
- 7.2. Market Analysis, Insights and Forecast - by Types
- 7.2.1. Embedded
- 7.2.2. Wall-mounted
- 7.2.3. Others
- 7.1. Market Analysis, Insights and Forecast - by Application
- 8. Europe Industrial Edge Computing Gateway Analysis, Insights and Forecast, 2020-2032
- 8.1. Market Analysis, Insights and Forecast - by Application
- 8.1.1. Manufacturing
- 8.1.2. Energy and Electricity
- 8.1.3. Transportation
- 8.1.4. Others
- 8.2. Market Analysis, Insights and Forecast - by Types
- 8.2.1. Embedded
- 8.2.2. Wall-mounted
- 8.2.3. Others
- 8.1. Market Analysis, Insights and Forecast - by Application
- 9. Middle East & Africa Industrial Edge Computing Gateway Analysis, Insights and Forecast, 2020-2032
- 9.1. Market Analysis, Insights and Forecast - by Application
- 9.1.1. Manufacturing
- 9.1.2. Energy and Electricity
- 9.1.3. Transportation
- 9.1.4. Others
- 9.2. Market Analysis, Insights and Forecast - by Types
- 9.2.1. Embedded
- 9.2.2. Wall-mounted
- 9.2.3. Others
- 9.1. Market Analysis, Insights and Forecast - by Application
- 10. Asia Pacific Industrial Edge Computing Gateway Analysis, Insights and Forecast, 2020-2032
- 10.1. Market Analysis, Insights and Forecast - by Application
- 10.1.1. Manufacturing
- 10.1.2. Energy and Electricity
- 10.1.3. Transportation
- 10.1.4. Others
- 10.2. Market Analysis, Insights and Forecast - by Types
- 10.2.1. Embedded
- 10.2.2. Wall-mounted
- 10.2.3. Others
- 10.1. Market Analysis, Insights and Forecast - by Application
- 11. Competitive Analysis
- 11.1. Global Market Share Analysis 2025
- 11.2. Company Profiles
- 11.2.1 DELL
- 11.2.1.1. Overview
- 11.2.1.2. Products
- 11.2.1.3. SWOT Analysis
- 11.2.1.4. Recent Developments
- 11.2.1.5. Financials (Based on Availability)
- 11.2.2 HPE
- 11.2.2.1. Overview
- 11.2.2.2. Products
- 11.2.2.3. SWOT Analysis
- 11.2.2.4. Recent Developments
- 11.2.2.5. Financials (Based on Availability)
- 11.2.3 Cisco
- 11.2.3.1. Overview
- 11.2.3.2. Products
- 11.2.3.3. SWOT Analysis
- 11.2.3.4. Recent Developments
- 11.2.3.5. Financials (Based on Availability)
- 11.2.4 Huawei
- 11.2.4.1. Overview
- 11.2.4.2. Products
- 11.2.4.3. SWOT Analysis
- 11.2.4.4. Recent Developments
- 11.2.4.5. Financials (Based on Availability)
- 11.2.5 ABB
- 11.2.5.1. Overview
- 11.2.5.2. Products
- 11.2.5.3. SWOT Analysis
- 11.2.5.4. Recent Developments
- 11.2.5.5. Financials (Based on Availability)
- 11.2.6 Advantech
- 11.2.6.1. Overview
- 11.2.6.2. Products
- 11.2.6.3. SWOT Analysis
- 11.2.6.4. Recent Developments
- 11.2.6.5. Financials (Based on Availability)
- 11.2.7 Fujitsu
- 11.2.7.1. Overview
- 11.2.7.2. Products
- 11.2.7.3. SWOT Analysis
- 11.2.7.4. Recent Developments
- 11.2.7.5. Financials (Based on Availability)
- 11.2.8 Eurotech
- 11.2.8.1. Overview
- 11.2.8.2. Products
- 11.2.8.3. SWOT Analysis
- 11.2.8.4. Recent Developments
- 11.2.8.5. Financials (Based on Availability)
- 11.2.9 Sierra Wireless
- 11.2.9.1. Overview
- 11.2.9.2. Products
- 11.2.9.3. SWOT Analysis
- 11.2.9.4. Recent Developments
- 11.2.9.5. Financials (Based on Availability)
- 11.2.10 AAEON
- 11.2.10.1. Overview
- 11.2.10.2. Products
- 11.2.10.3. SWOT Analysis
- 11.2.10.4. Recent Developments
- 11.2.10.5. Financials (Based on Availability)
- 11.2.11 Hirschmann
- 11.2.11.1. Overview
- 11.2.11.2. Products
- 11.2.11.3. SWOT Analysis
- 11.2.11.4. Recent Developments
- 11.2.11.5. Financials (Based on Availability)
- 11.2.12 ADLINK Technology
- 11.2.12.1. Overview
- 11.2.12.2. Products
- 11.2.12.3. SWOT Analysis
- 11.2.12.4. Recent Developments
- 11.2.12.5. Financials (Based on Availability)
- 11.2.13 Digi International
- 11.2.13.1. Overview
- 11.2.13.2. Products
- 11.2.13.3. SWOT Analysis
- 11.2.13.4. Recent Developments
- 11.2.13.5. Financials (Based on Availability)
- 11.2.14 Beijing InHand Networks Technology
- 11.2.14.1. Overview
- 11.2.14.2. Products
- 11.2.14.3. SWOT Analysis
- 11.2.14.4. Recent Developments
- 11.2.14.5. Financials (Based on Availability)
- 11.2.1 DELL
List of Figures
- Figure 1: Global Industrial Edge Computing Gateway Revenue Breakdown (undefined, %) by Region 2025 & 2033
- Figure 2: Global Industrial Edge Computing Gateway Volume Breakdown (K, %) by Region 2025 & 2033
- Figure 3: North America Industrial Edge Computing Gateway Revenue (undefined), by Application 2025 & 2033
- Figure 4: North America Industrial Edge Computing Gateway Volume (K), by Application 2025 & 2033
- Figure 5: North America Industrial Edge Computing Gateway Revenue Share (%), by Application 2025 & 2033
- Figure 6: North America Industrial Edge Computing Gateway Volume Share (%), by Application 2025 & 2033
- Figure 7: North America Industrial Edge Computing Gateway Revenue (undefined), by Types 2025 & 2033
- Figure 8: North America Industrial Edge Computing Gateway Volume (K), by Types 2025 & 2033
- Figure 9: North America Industrial Edge Computing Gateway Revenue Share (%), by Types 2025 & 2033
- Figure 10: North America Industrial Edge Computing Gateway Volume Share (%), by Types 2025 & 2033
- Figure 11: North America Industrial Edge Computing Gateway Revenue (undefined), by Country 2025 & 2033
- Figure 12: North America Industrial Edge Computing Gateway Volume (K), by Country 2025 & 2033
- Figure 13: North America Industrial Edge Computing Gateway Revenue Share (%), by Country 2025 & 2033
- Figure 14: North America Industrial Edge Computing Gateway Volume Share (%), by Country 2025 & 2033
- Figure 15: South America Industrial Edge Computing Gateway Revenue (undefined), by Application 2025 & 2033
- Figure 16: South America Industrial Edge Computing Gateway Volume (K), by Application 2025 & 2033
- Figure 17: South America Industrial Edge Computing Gateway Revenue Share (%), by Application 2025 & 2033
- Figure 18: South America Industrial Edge Computing Gateway Volume Share (%), by Application 2025 & 2033
- Figure 19: South America Industrial Edge Computing Gateway Revenue (undefined), by Types 2025 & 2033
- Figure 20: South America Industrial Edge Computing Gateway Volume (K), by Types 2025 & 2033
- Figure 21: South America Industrial Edge Computing Gateway Revenue Share (%), by Types 2025 & 2033
- Figure 22: South America Industrial Edge Computing Gateway Volume Share (%), by Types 2025 & 2033
- Figure 23: South America Industrial Edge Computing Gateway Revenue (undefined), by Country 2025 & 2033
- Figure 24: South America Industrial Edge Computing Gateway Volume (K), by Country 2025 & 2033
- Figure 25: South America Industrial Edge Computing Gateway Revenue Share (%), by Country 2025 & 2033
- Figure 26: South America Industrial Edge Computing Gateway Volume Share (%), by Country 2025 & 2033
- Figure 27: Europe Industrial Edge Computing Gateway Revenue (undefined), by Application 2025 & 2033
- Figure 28: Europe Industrial Edge Computing Gateway Volume (K), by Application 2025 & 2033
- Figure 29: Europe Industrial Edge Computing Gateway Revenue Share (%), by Application 2025 & 2033
- Figure 30: Europe Industrial Edge Computing Gateway Volume Share (%), by Application 2025 & 2033
- Figure 31: Europe Industrial Edge Computing Gateway Revenue (undefined), by Types 2025 & 2033
- Figure 32: Europe Industrial Edge Computing Gateway Volume (K), by Types 2025 & 2033
- Figure 33: Europe Industrial Edge Computing Gateway Revenue Share (%), by Types 2025 & 2033
- Figure 34: Europe Industrial Edge Computing Gateway Volume Share (%), by Types 2025 & 2033
- Figure 35: Europe Industrial Edge Computing Gateway Revenue (undefined), by Country 2025 & 2033
- Figure 36: Europe Industrial Edge Computing Gateway Volume (K), by Country 2025 & 2033
- Figure 37: Europe Industrial Edge Computing Gateway Revenue Share (%), by Country 2025 & 2033
- Figure 38: Europe Industrial Edge Computing Gateway Volume Share (%), by Country 2025 & 2033
- Figure 39: Middle East & Africa Industrial Edge Computing Gateway Revenue (undefined), by Application 2025 & 2033
- Figure 40: Middle East & Africa Industrial Edge Computing Gateway Volume (K), by Application 2025 & 2033
- Figure 41: Middle East & Africa Industrial Edge Computing Gateway Revenue Share (%), by Application 2025 & 2033
- Figure 42: Middle East & Africa Industrial Edge Computing Gateway Volume Share (%), by Application 2025 & 2033
- Figure 43: Middle East & Africa Industrial Edge Computing Gateway Revenue (undefined), by Types 2025 & 2033
- Figure 44: Middle East & Africa Industrial Edge Computing Gateway Volume (K), by Types 2025 & 2033
- Figure 45: Middle East & Africa Industrial Edge Computing Gateway Revenue Share (%), by Types 2025 & 2033
- Figure 46: Middle East & Africa Industrial Edge Computing Gateway Volume Share (%), by Types 2025 & 2033
- Figure 47: Middle East & Africa Industrial Edge Computing Gateway Revenue (undefined), by Country 2025 & 2033
- Figure 48: Middle East & Africa Industrial Edge Computing Gateway Volume (K), by Country 2025 & 2033
- Figure 49: Middle East & Africa Industrial Edge Computing Gateway Revenue Share (%), by Country 2025 & 2033
- Figure 50: Middle East & Africa Industrial Edge Computing Gateway Volume Share (%), by Country 2025 & 2033
- Figure 51: Asia Pacific Industrial Edge Computing Gateway Revenue (undefined), by Application 2025 & 2033
- Figure 52: Asia Pacific Industrial Edge Computing Gateway Volume (K), by Application 2025 & 2033
- Figure 53: Asia Pacific Industrial Edge Computing Gateway Revenue Share (%), by Application 2025 & 2033
- Figure 54: Asia Pacific Industrial Edge Computing Gateway Volume Share (%), by Application 2025 & 2033
- Figure 55: Asia Pacific Industrial Edge Computing Gateway Revenue (undefined), by Types 2025 & 2033
- Figure 56: Asia Pacific Industrial Edge Computing Gateway Volume (K), by Types 2025 & 2033
- Figure 57: Asia Pacific Industrial Edge Computing Gateway Revenue Share (%), by Types 2025 & 2033
- Figure 58: Asia Pacific Industrial Edge Computing Gateway Volume Share (%), by Types 2025 & 2033
- Figure 59: Asia Pacific Industrial Edge Computing Gateway Revenue (undefined), by Country 2025 & 2033
- Figure 60: Asia Pacific Industrial Edge Computing Gateway Volume (K), by Country 2025 & 2033
- Figure 61: Asia Pacific Industrial Edge Computing Gateway Revenue Share (%), by Country 2025 & 2033
- Figure 62: Asia Pacific Industrial Edge Computing Gateway Volume Share (%), by Country 2025 & 2033
List of Tables
- Table 1: Global Industrial Edge Computing Gateway Revenue undefined Forecast, by Application 2020 & 2033
- Table 2: Global Industrial Edge Computing Gateway Volume K Forecast, by Application 2020 & 2033
- Table 3: Global Industrial Edge Computing Gateway Revenue undefined Forecast, by Types 2020 & 2033
- Table 4: Global Industrial Edge Computing Gateway Volume K Forecast, by Types 2020 & 2033
- Table 5: Global Industrial Edge Computing Gateway Revenue undefined Forecast, by Region 2020 & 2033
- Table 6: Global Industrial Edge Computing Gateway Volume K Forecast, by Region 2020 & 2033
- Table 7: Global Industrial Edge Computing Gateway Revenue undefined Forecast, by Application 2020 & 2033
- Table 8: Global Industrial Edge Computing Gateway Volume K Forecast, by Application 2020 & 2033
- Table 9: Global Industrial Edge Computing Gateway Revenue undefined Forecast, by Types 2020 & 2033
- Table 10: Global Industrial Edge Computing Gateway Volume K Forecast, by Types 2020 & 2033
- Table 11: Global Industrial Edge Computing Gateway Revenue undefined Forecast, by Country 2020 & 2033
- Table 12: Global Industrial Edge Computing Gateway Volume K Forecast, by Country 2020 & 2033
- Table 13: United States Industrial Edge Computing Gateway Revenue (undefined) Forecast, by Application 2020 & 2033
- Table 14: United States Industrial Edge Computing Gateway Volume (K) Forecast, by Application 2020 & 2033
- Table 15: Canada Industrial Edge Computing Gateway Revenue (undefined) Forecast, by Application 2020 & 2033
- Table 16: Canada Industrial Edge Computing Gateway Volume (K) Forecast, by Application 2020 & 2033
- Table 17: Mexico Industrial Edge Computing Gateway Revenue (undefined) Forecast, by Application 2020 & 2033
- Table 18: Mexico Industrial Edge Computing Gateway Volume (K) Forecast, by Application 2020 & 2033
- Table 19: Global Industrial Edge Computing Gateway Revenue undefined Forecast, by Application 2020 & 2033
- Table 20: Global Industrial Edge Computing Gateway Volume K Forecast, by Application 2020 & 2033
- Table 21: Global Industrial Edge Computing Gateway Revenue undefined Forecast, by Types 2020 & 2033
- Table 22: Global Industrial Edge Computing Gateway Volume K Forecast, by Types 2020 & 2033
- Table 23: Global Industrial Edge Computing Gateway Revenue undefined Forecast, by Country 2020 & 2033
- Table 24: Global Industrial Edge Computing Gateway Volume K Forecast, by Country 2020 & 2033
- Table 25: Brazil Industrial Edge Computing Gateway Revenue (undefined) Forecast, by Application 2020 & 2033
- Table 26: Brazil Industrial Edge Computing Gateway Volume (K) Forecast, by Application 2020 & 2033
- Table 27: Argentina Industrial Edge Computing Gateway Revenue (undefined) Forecast, by Application 2020 & 2033
- Table 28: Argentina Industrial Edge Computing Gateway Volume (K) Forecast, by Application 2020 & 2033
- Table 29: Rest of South America Industrial Edge Computing Gateway Revenue (undefined) Forecast, by Application 2020 & 2033
- Table 30: Rest of South America Industrial Edge Computing Gateway Volume (K) Forecast, by Application 2020 & 2033
- Table 31: Global Industrial Edge Computing Gateway Revenue undefined Forecast, by Application 2020 & 2033
- Table 32: Global Industrial Edge Computing Gateway Volume K Forecast, by Application 2020 & 2033
- Table 33: Global Industrial Edge Computing Gateway Revenue undefined Forecast, by Types 2020 & 2033
- Table 34: Global Industrial Edge Computing Gateway Volume K Forecast, by Types 2020 & 2033
- Table 35: Global Industrial Edge Computing Gateway Revenue undefined Forecast, by Country 2020 & 2033
- Table 36: Global Industrial Edge Computing Gateway Volume K Forecast, by Country 2020 & 2033
- Table 37: United Kingdom Industrial Edge Computing Gateway Revenue (undefined) Forecast, by Application 2020 & 2033
- Table 38: United Kingdom Industrial Edge Computing Gateway Volume (K) Forecast, by Application 2020 & 2033
- Table 39: Germany Industrial Edge Computing Gateway Revenue (undefined) Forecast, by Application 2020 & 2033
- Table 40: Germany Industrial Edge Computing Gateway Volume (K) Forecast, by Application 2020 & 2033
- Table 41: France Industrial Edge Computing Gateway Revenue (undefined) Forecast, by Application 2020 & 2033
- Table 42: France Industrial Edge Computing Gateway Volume (K) Forecast, by Application 2020 & 2033
- Table 43: Italy Industrial Edge Computing Gateway Revenue (undefined) Forecast, by Application 2020 & 2033
- Table 44: Italy Industrial Edge Computing Gateway Volume (K) Forecast, by Application 2020 & 2033
- Table 45: Spain Industrial Edge Computing Gateway Revenue (undefined) Forecast, by Application 2020 & 2033
- Table 46: Spain Industrial Edge Computing Gateway Volume (K) Forecast, by Application 2020 & 2033
- Table 47: Russia Industrial Edge Computing Gateway Revenue (undefined) Forecast, by Application 2020 & 2033
- Table 48: Russia Industrial Edge Computing Gateway Volume (K) Forecast, by Application 2020 & 2033
- Table 49: Benelux Industrial Edge Computing Gateway Revenue (undefined) Forecast, by Application 2020 & 2033
- Table 50: Benelux Industrial Edge Computing Gateway Volume (K) Forecast, by Application 2020 & 2033
- Table 51: Nordics Industrial Edge Computing Gateway Revenue (undefined) Forecast, by Application 2020 & 2033
- Table 52: Nordics Industrial Edge Computing Gateway Volume (K) Forecast, by Application 2020 & 2033
- Table 53: Rest of Europe Industrial Edge Computing Gateway Revenue (undefined) Forecast, by Application 2020 & 2033
- Table 54: Rest of Europe Industrial Edge Computing Gateway Volume (K) Forecast, by Application 2020 & 2033
- Table 55: Global Industrial Edge Computing Gateway Revenue undefined Forecast, by Application 2020 & 2033
- Table 56: Global Industrial Edge Computing Gateway Volume K Forecast, by Application 2020 & 2033
- Table 57: Global Industrial Edge Computing Gateway Revenue undefined Forecast, by Types 2020 & 2033
- Table 58: Global Industrial Edge Computing Gateway Volume K Forecast, by Types 2020 & 2033
- Table 59: Global Industrial Edge Computing Gateway Revenue undefined Forecast, by Country 2020 & 2033
- Table 60: Global Industrial Edge Computing Gateway Volume K Forecast, by Country 2020 & 2033
- Table 61: Turkey Industrial Edge Computing Gateway Revenue (undefined) Forecast, by Application 2020 & 2033
- Table 62: Turkey Industrial Edge Computing Gateway Volume (K) Forecast, by Application 2020 & 2033
- Table 63: Israel Industrial Edge Computing Gateway Revenue (undefined) Forecast, by Application 2020 & 2033
- Table 64: Israel Industrial Edge Computing Gateway Volume (K) Forecast, by Application 2020 & 2033
- Table 65: GCC Industrial Edge Computing Gateway Revenue (undefined) Forecast, by Application 2020 & 2033
- Table 66: GCC Industrial Edge Computing Gateway Volume (K) Forecast, by Application 2020 & 2033
- Table 67: North Africa Industrial Edge Computing Gateway Revenue (undefined) Forecast, by Application 2020 & 2033
- Table 68: North Africa Industrial Edge Computing Gateway Volume (K) Forecast, by Application 2020 & 2033
- Table 69: South Africa Industrial Edge Computing Gateway Revenue (undefined) Forecast, by Application 2020 & 2033
- Table 70: South Africa Industrial Edge Computing Gateway Volume (K) Forecast, by Application 2020 & 2033
- Table 71: Rest of Middle East & Africa Industrial Edge Computing Gateway Revenue (undefined) Forecast, by Application 2020 & 2033
- Table 72: Rest of Middle East & Africa Industrial Edge Computing Gateway Volume (K) Forecast, by Application 2020 & 2033
- Table 73: Global Industrial Edge Computing Gateway Revenue undefined Forecast, by Application 2020 & 2033
- Table 74: Global Industrial Edge Computing Gateway Volume K Forecast, by Application 2020 & 2033
- Table 75: Global Industrial Edge Computing Gateway Revenue undefined Forecast, by Types 2020 & 2033
- Table 76: Global Industrial Edge Computing Gateway Volume K Forecast, by Types 2020 & 2033
- Table 77: Global Industrial Edge Computing Gateway Revenue undefined Forecast, by Country 2020 & 2033
- Table 78: Global Industrial Edge Computing Gateway Volume K Forecast, by Country 2020 & 2033
- Table 79: China Industrial Edge Computing Gateway Revenue (undefined) Forecast, by Application 2020 & 2033
- Table 80: China Industrial Edge Computing Gateway Volume (K) Forecast, by Application 2020 & 2033
- Table 81: India Industrial Edge Computing Gateway Revenue (undefined) Forecast, by Application 2020 & 2033
- Table 82: India Industrial Edge Computing Gateway Volume (K) Forecast, by Application 2020 & 2033
- Table 83: Japan Industrial Edge Computing Gateway Revenue (undefined) Forecast, by Application 2020 & 2033
- Table 84: Japan Industrial Edge Computing Gateway Volume (K) Forecast, by Application 2020 & 2033
- Table 85: South Korea Industrial Edge Computing Gateway Revenue (undefined) Forecast, by Application 2020 & 2033
- Table 86: South Korea Industrial Edge Computing Gateway Volume (K) Forecast, by Application 2020 & 2033
- Table 87: ASEAN Industrial Edge Computing Gateway Revenue (undefined) Forecast, by Application 2020 & 2033
- Table 88: ASEAN Industrial Edge Computing Gateway Volume (K) Forecast, by Application 2020 & 2033
- Table 89: Oceania Industrial Edge Computing Gateway Revenue (undefined) Forecast, by Application 2020 & 2033
- Table 90: Oceania Industrial Edge Computing Gateway Volume (K) Forecast, by Application 2020 & 2033
- Table 91: Rest of Asia Pacific Industrial Edge Computing Gateway Revenue (undefined) Forecast, by Application 2020 & 2033
- Table 92: Rest of Asia Pacific Industrial Edge Computing Gateway Volume (K) Forecast, by Application 2020 & 2033
Frequently Asked Questions
1. What is the projected Compound Annual Growth Rate (CAGR) of the Industrial Edge Computing Gateway?
The projected CAGR is approximately 22.4%.
2. Which companies are prominent players in the Industrial Edge Computing Gateway?
Key companies in the market include DELL, HPE, Cisco, Huawei, ABB, Advantech, Fujitsu, Eurotech, Sierra Wireless, AAEON, Hirschmann, ADLINK Technology, Digi International, Beijing InHand Networks Technology.
3. What are the main segments of the Industrial Edge Computing Gateway?
The market segments include Application, Types.
4. Can you provide details about the market size?
The market size is estimated to be USD XXX N/A as of 2022.
5. What are some drivers contributing to market growth?
N/A
6. What are the notable trends driving market growth?
N/A
7. Are there any restraints impacting market growth?
N/A
8. Can you provide examples of recent developments in the market?
N/A
9. What pricing options are available for accessing the report?
Pricing options include single-user, multi-user, and enterprise licenses priced at USD 3350.00, USD 5025.00, and USD 6700.00 respectively.
10. Is the market size provided in terms of value or volume?
The market size is provided in terms of value, measured in N/A and volume, measured in K.
11. Are there any specific market keywords associated with the report?
Yes, the market keyword associated with the report is "Industrial Edge Computing Gateway," which aids in identifying and referencing the specific market segment covered.
12. How do I determine which pricing option suits my needs best?
The pricing options vary based on user requirements and access needs. Individual users may opt for single-user licenses, while businesses requiring broader access may choose multi-user or enterprise licenses for cost-effective access to the report.
13. Are there any additional resources or data provided in the Industrial Edge Computing Gateway report?
While the report offers comprehensive insights, it's advisable to review the specific contents or supplementary materials provided to ascertain if additional resources or data are available.
14. How can I stay updated on further developments or reports in the Industrial Edge Computing Gateway?
To stay informed about further developments, trends, and reports in the Industrial Edge Computing Gateway, consider subscribing to industry newsletters, following relevant companies and organizations, or regularly checking reputable industry news sources and publications.
Methodology
Step 1 - Identification of Relevant Samples Size from Population Database


Step 2 - Approaches for Defining Global Market Size (Value, Volume* & Price*)

Note*: In applicable scenarios
Step 3 - Data Sources
Primary Research
- Web Analytics
- Survey Reports
- Research Institute
- Latest Research Reports
- Opinion Leaders
Secondary Research
- Annual Reports
- White Paper
- Latest Press Release
- Industry Association
- Paid Database
- Investor Presentations

Step 4 - Data Triangulation
Involves using different sources of information in order to increase the validity of a study
These sources are likely to be stakeholders in a program - participants, other researchers, program staff, other community members, and so on.
Then we put all data in single framework & apply various statistical tools to find out the dynamic on the market.
During the analysis stage, feedback from the stakeholder groups would be compared to determine areas of agreement as well as areas of divergence