
Key Insights
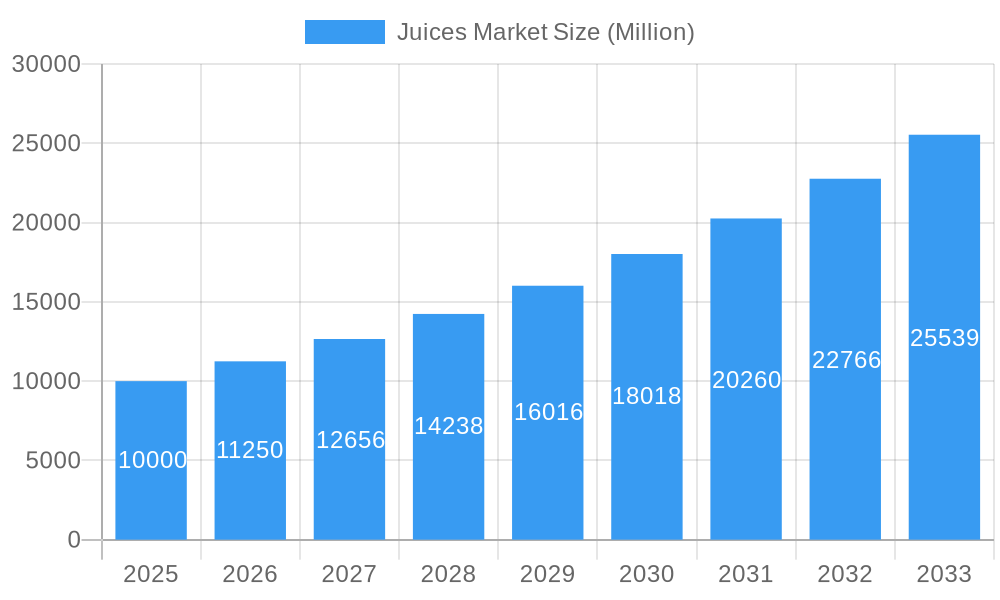
The global juice market is projected to reach $159.1 billion by 2033, exhibiting a compound annual growth rate (CAGR) of 4.31% from 2024. This growth is driven by increasing health consciousness, demand for natural and functional beverages, and the convenience of ready-to-drink options. Emerging economies with rising disposable incomes also present significant growth opportunities. However, raw material price volatility and concerns over added sugar content pose potential restraints. Market segmentation highlights the dominance of 100% juices, with PET bottles leading in packaging. Key players are actively engaged in strategic initiatives to capture market share.
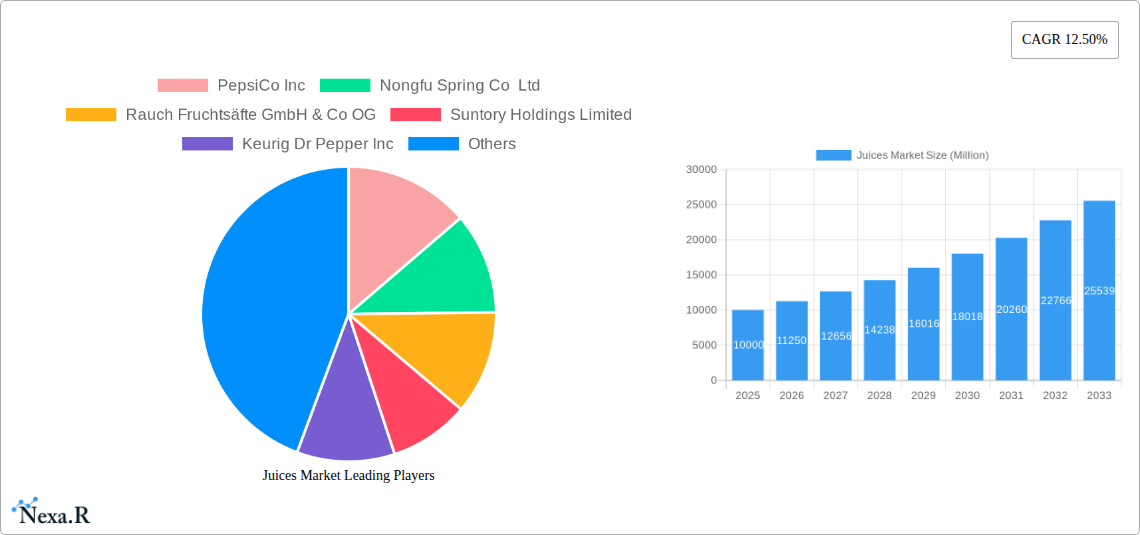
Juices Market Market Size (In Billion)
Future market expansion will be contingent on continuous innovation in healthier formulations, premiumization, and entry into new geographical regions. Addressing sugar concerns and adopting sustainable packaging practices will be crucial for long-term success. The projected CAGR indicates substantial growth potential, offering attractive investment prospects for adaptable companies.
Juices Market Company Market Share
Juices Market Report: A Comprehensive Analysis (2019-2033)
This in-depth report provides a comprehensive analysis of the global Juices Market, encompassing historical data (2019-2024), current estimates (2025), and future forecasts (2025-2033). The study delves into market dynamics, growth trends, regional dominance, product landscapes, key players, and emerging opportunities within the broader beverage industry. It's an essential resource for industry professionals, investors, and strategic decision-makers seeking a nuanced understanding of this dynamic sector.
Juices Market Dynamics & Structure
The global juices market is characterized by a moderately consolidated structure, with key players like PepsiCo Inc, The Coca-Cola Company, and Suntory Holdings Limited holding significant market share. However, regional players and smaller brands also contribute substantially, particularly within specific segments and geographic areas. Technological innovation, such as improved preservation techniques and sustainable packaging, are key drivers. Stringent regulatory frameworks concerning sugar content and labeling influence product formulations and marketing strategies. Competition from other beverages, including carbonated soft drinks and functional drinks, presents a significant challenge. The market has witnessed several mergers and acquisitions (M&A) in recent years, aiming to expand product portfolios and geographic reach. Approximately xx M&A deals were recorded between 2019 and 2024, resulting in a xx% increase in market concentration.
- Market Concentration: Moderately consolidated, with top players holding xx% market share in 2024.
- Technological Innovation: Focus on sustainable packaging (PET bottles, aseptic packages), improved preservation, and functional juice blends.
- Regulatory Framework: Stringent regulations regarding sugar content and labeling impact product formulation and marketing.
- Competitive Substitutes: Carbonated soft drinks, functional beverages, and other non-alcoholic drinks.
- M&A Activity: xx deals between 2019-2024, driving consolidation and expansion.
- Innovation Barriers: High R&D costs, stringent regulations, and consumer preference for established brands.
Juices Market Growth Trends & Insights
The global juices market experienced robust growth during the historical period (2019-2024), driven by increasing health consciousness and a shift towards healthier beverage options. The market size reached xx million units in 2024, exhibiting a CAGR of xx%. This growth is expected to continue during the forecast period (2025-2033), albeit at a slightly moderated pace, reaching xx million units by 2033 with a projected CAGR of xx%. Technological disruptions, such as the introduction of innovative packaging and functional juice blends, are fueling market expansion. Changing consumer preferences towards natural, organic, and functional beverages are shaping product innovation. Market penetration of premium and specialized juice varieties is steadily increasing. The increasing adoption of e-commerce channels further facilitates market growth.
Dominant Regions, Countries, or Segments in Juices Market
North America and Europe currently dominate the global juices market, driven by high per capita consumption and strong consumer preference for convenient and healthier beverage options. Within these regions, the off-trade distribution channel contributes significantly, with PET bottles and aseptic packages being the preferred packaging types. The 100% juice segment exhibits strong growth, driven by rising health awareness. However, juice drinks (up to 24% juice) and nectars (25-99% juice) retain significant market share due to their affordability and widespread appeal. Asia-Pacific is experiencing rapid growth, propelled by increasing disposable incomes and changing lifestyle patterns.
- Leading Region: North America
- Key Drivers: High per capita consumption, health consciousness, and developed retail infrastructure.
- Dominant Segments: 100% juice, juice drinks (up to 24% juice), PET bottles, and off-trade distribution channel.
- Growth Potential: Asia-Pacific, driven by rising disposable incomes and evolving consumer preferences.
Juices Market Product Landscape
Product innovation within the juices market centers on enhancing taste, offering functional benefits, and utilizing sustainable packaging. Companies are introducing innovative blends combining fruits, vegetables, and functional ingredients, catering to evolving health and wellness trends. Unique selling propositions (USPs) include organic certifications, cold-pressed extraction methods, and the use of natural sweeteners. Technological advancements in packaging, such as aseptic processing and lightweight PET bottles, enhance shelf life and reduce environmental impact.
Key Drivers, Barriers & Challenges in Juices Market
Key Drivers:
- Growing health consciousness among consumers.
- Increasing demand for convenient and on-the-go beverages.
- Rise in disposable incomes, particularly in developing economies.
- Technological advancements in packaging and processing.
Challenges and Restraints:
- Fluctuations in fruit prices and supply chain disruptions.
- Stringent regulations related to sugar content and labeling.
- Intense competition from other beverage categories.
- Consumer concerns about artificial sweeteners and preservatives.
Emerging Opportunities in Juices Market
- Premiumization: Growing demand for premium and organic juices with added health benefits.
- Functional Juices: Increasing interest in juices enriched with vitamins, minerals, and probiotics.
- Sustainable Packaging: Growing consumer preference for eco-friendly packaging options.
- E-commerce Growth: Expanding online sales channels offer new opportunities for market penetration.
Growth Accelerators in the Juices Market Industry
Long-term growth in the juices market will be propelled by sustained consumer demand for healthier beverages, innovation in product formulations and packaging, and strategic partnerships across the value chain. Technological advancements in processing and preservation will extend shelf life and expand market reach. Expansion into new geographic markets and strategic collaborations with retailers and food service providers will create further growth opportunities.
Key Players Shaping the Juices Market Market
- PepsiCo Inc
- Nongfu Spring Co Ltd
- Rauch Fruchtsäfte GmbH & Co OG
- Suntory Holdings Limited
- Keurig Dr Pepper Inc
- The Kraft Heinz Company
- Tingyi (Cayman Islands) Holding Corporation
- The Coca-Cola Company
- Uni-President Enterprises Corp
- Britvic PLC
- Tropicana Brands Group
- Thai Beverages PCL
- Eckes-Granini Group GmbH
Notable Milestones in Juices Market Sector
- July 2022: Capri Sun reduced added sugar content by 40% using monk fruit juice.
- February 2023: Capri Sun announced takeover of sales and distribution from Coca-Cola in several European countries by 2024.
- June 2023: Capri-Sun launched a new Jungle Drink in six flavors.
In-Depth Juices Market Market Outlook
The future of the juices market is bright, driven by sustained demand for healthier and convenient beverages. Continued innovation in product formulations, sustainable packaging, and marketing strategies will be crucial for success. Strategic partnerships and expansion into emerging markets will unlock further growth potential. The focus on premiumization, functional benefits, and organic certifications will define the market landscape in the coming years. The market is poised for sustained growth, with significant opportunities for companies that can adapt to evolving consumer preferences and market dynamics.
Juices Market Segmentation
-
1. Soft Drink Type
- 1.1. 100% Juice
- 1.2. Juice Drinks (up to 24% Juice)
- 1.3. Juice concentrates
- 1.4. Nectars (25-99% Juice)
-
2. Packaging Type
- 2.1. Aseptic packages
- 2.2. Disposable Cups
- 2.3. Glass Bottles
- 2.4. Metal Can
- 2.5. PET Bottles
-
3. Distribution Channel
-
3.1. Off-trade
- 3.1.1. Convenience Stores
- 3.1.2. Online Retail
- 3.1.3. Supermarket/Hypermarket
- 3.1.4. Others
- 3.2. On-trade
-
3.1. Off-trade
Juices Market Segmentation By Geography
-
1. North America
- 1.1. United States
- 1.2. Canada
- 1.3. Mexico
-
2. South America
- 2.1. Brazil
- 2.2. Argentina
- 2.3. Rest of South America
-
3. Europe
- 3.1. United Kingdom
- 3.2. Germany
- 3.3. France
- 3.4. Italy
- 3.5. Spain
- 3.6. Russia
- 3.7. Benelux
- 3.8. Nordics
- 3.9. Rest of Europe
-
4. Middle East & Africa
- 4.1. Turkey
- 4.2. Israel
- 4.3. GCC
- 4.4. North Africa
- 4.5. South Africa
- 4.6. Rest of Middle East & Africa
-
5. Asia Pacific
- 5.1. China
- 5.2. India
- 5.3. Japan
- 5.4. South Korea
- 5.5. ASEAN
- 5.6. Oceania
- 5.7. Rest of Asia Pacific
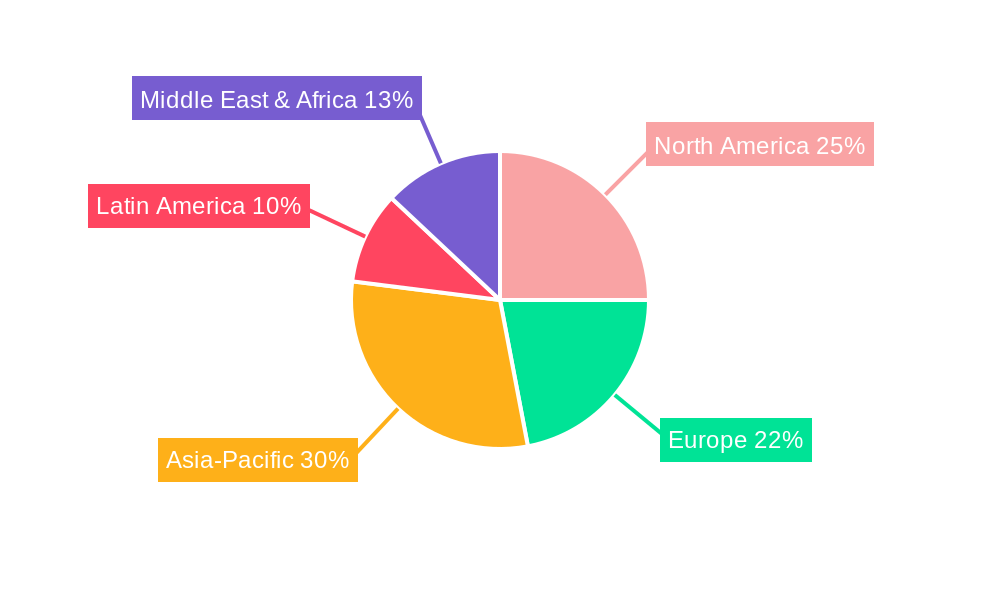
Juices Market Regional Market Share
Geographic Coverage of Juices Market
Juices Market REPORT HIGHLIGHTS
| Aspects | Details |
|---|---|
| Study Period | 2020-2034 |
| Base Year | 2025 |
| Estimated Year | 2026 |
| Forecast Period | 2026-2034 |
| Historical Period | 2020-2025 |
| Growth Rate | CAGR of 4.31% from 2020-2034 |
| Segmentation |
|
Table of Contents
- 1. Introduction
- 1.1. Research Scope
- 1.2. Market Segmentation
- 1.3. Research Methodology
- 1.4. Definitions and Assumptions
- 2. Executive Summary
- 2.1. Introduction
- 3. Market Dynamics
- 3.1. Introduction
- 3.2. Market Drivers
- 3.2.1. Increasing Demand for Supplement Nutrition; Growing Casein Application in Processed Food Products
- 3.3. Market Restrains
- 3.3.1. Competition from Vegan/Plant-based Protein Powders
- 3.4. Market Trends
- 3.4.1. OTHER KEY INDUSTRY TRENDS COVERED IN THE REPORT
- 4. Market Factor Analysis
- 4.1. Porters Five Forces
- 4.2. Supply/Value Chain
- 4.3. PESTEL analysis
- 4.4. Market Entropy
- 4.5. Patent/Trademark Analysis
- 5. Global Juices Market Analysis, Insights and Forecast, 2020-2032
- 5.1. Market Analysis, Insights and Forecast - by Soft Drink Type
- 5.1.1. 100% Juice
- 5.1.2. Juice Drinks (up to 24% Juice)
- 5.1.3. Juice concentrates
- 5.1.4. Nectars (25-99% Juice)
- 5.2. Market Analysis, Insights and Forecast - by Packaging Type
- 5.2.1. Aseptic packages
- 5.2.2. Disposable Cups
- 5.2.3. Glass Bottles
- 5.2.4. Metal Can
- 5.2.5. PET Bottles
- 5.3. Market Analysis, Insights and Forecast - by Distribution Channel
- 5.3.1. Off-trade
- 5.3.1.1. Convenience Stores
- 5.3.1.2. Online Retail
- 5.3.1.3. Supermarket/Hypermarket
- 5.3.1.4. Others
- 5.3.2. On-trade
- 5.3.1. Off-trade
- 5.4. Market Analysis, Insights and Forecast - by Region
- 5.4.1. North America
- 5.4.2. South America
- 5.4.3. Europe
- 5.4.4. Middle East & Africa
- 5.4.5. Asia Pacific
- 5.1. Market Analysis, Insights and Forecast - by Soft Drink Type
- 6. North America Juices Market Analysis, Insights and Forecast, 2020-2032
- 6.1. Market Analysis, Insights and Forecast - by Soft Drink Type
- 6.1.1. 100% Juice
- 6.1.2. Juice Drinks (up to 24% Juice)
- 6.1.3. Juice concentrates
- 6.1.4. Nectars (25-99% Juice)
- 6.2. Market Analysis, Insights and Forecast - by Packaging Type
- 6.2.1. Aseptic packages
- 6.2.2. Disposable Cups
- 6.2.3. Glass Bottles
- 6.2.4. Metal Can
- 6.2.5. PET Bottles
- 6.3. Market Analysis, Insights and Forecast - by Distribution Channel
- 6.3.1. Off-trade
- 6.3.1.1. Convenience Stores
- 6.3.1.2. Online Retail
- 6.3.1.3. Supermarket/Hypermarket
- 6.3.1.4. Others
- 6.3.2. On-trade
- 6.3.1. Off-trade
- 6.1. Market Analysis, Insights and Forecast - by Soft Drink Type
- 7. South America Juices Market Analysis, Insights and Forecast, 2020-2032
- 7.1. Market Analysis, Insights and Forecast - by Soft Drink Type
- 7.1.1. 100% Juice
- 7.1.2. Juice Drinks (up to 24% Juice)
- 7.1.3. Juice concentrates
- 7.1.4. Nectars (25-99% Juice)
- 7.2. Market Analysis, Insights and Forecast - by Packaging Type
- 7.2.1. Aseptic packages
- 7.2.2. Disposable Cups
- 7.2.3. Glass Bottles
- 7.2.4. Metal Can
- 7.2.5. PET Bottles
- 7.3. Market Analysis, Insights and Forecast - by Distribution Channel
- 7.3.1. Off-trade
- 7.3.1.1. Convenience Stores
- 7.3.1.2. Online Retail
- 7.3.1.3. Supermarket/Hypermarket
- 7.3.1.4. Others
- 7.3.2. On-trade
- 7.3.1. Off-trade
- 7.1. Market Analysis, Insights and Forecast - by Soft Drink Type
- 8. Europe Juices Market Analysis, Insights and Forecast, 2020-2032
- 8.1. Market Analysis, Insights and Forecast - by Soft Drink Type
- 8.1.1. 100% Juice
- 8.1.2. Juice Drinks (up to 24% Juice)
- 8.1.3. Juice concentrates
- 8.1.4. Nectars (25-99% Juice)
- 8.2. Market Analysis, Insights and Forecast - by Packaging Type
- 8.2.1. Aseptic packages
- 8.2.2. Disposable Cups
- 8.2.3. Glass Bottles
- 8.2.4. Metal Can
- 8.2.5. PET Bottles
- 8.3. Market Analysis, Insights and Forecast - by Distribution Channel
- 8.3.1. Off-trade
- 8.3.1.1. Convenience Stores
- 8.3.1.2. Online Retail
- 8.3.1.3. Supermarket/Hypermarket
- 8.3.1.4. Others
- 8.3.2. On-trade
- 8.3.1. Off-trade
- 8.1. Market Analysis, Insights and Forecast - by Soft Drink Type
- 9. Middle East & Africa Juices Market Analysis, Insights and Forecast, 2020-2032
- 9.1. Market Analysis, Insights and Forecast - by Soft Drink Type
- 9.1.1. 100% Juice
- 9.1.2. Juice Drinks (up to 24% Juice)
- 9.1.3. Juice concentrates
- 9.1.4. Nectars (25-99% Juice)
- 9.2. Market Analysis, Insights and Forecast - by Packaging Type
- 9.2.1. Aseptic packages
- 9.2.2. Disposable Cups
- 9.2.3. Glass Bottles
- 9.2.4. Metal Can
- 9.2.5. PET Bottles
- 9.3. Market Analysis, Insights and Forecast - by Distribution Channel
- 9.3.1. Off-trade
- 9.3.1.1. Convenience Stores
- 9.3.1.2. Online Retail
- 9.3.1.3. Supermarket/Hypermarket
- 9.3.1.4. Others
- 9.3.2. On-trade
- 9.3.1. Off-trade
- 9.1. Market Analysis, Insights and Forecast - by Soft Drink Type
- 10. Asia Pacific Juices Market Analysis, Insights and Forecast, 2020-2032
- 10.1. Market Analysis, Insights and Forecast - by Soft Drink Type
- 10.1.1. 100% Juice
- 10.1.2. Juice Drinks (up to 24% Juice)
- 10.1.3. Juice concentrates
- 10.1.4. Nectars (25-99% Juice)
- 10.2. Market Analysis, Insights and Forecast - by Packaging Type
- 10.2.1. Aseptic packages
- 10.2.2. Disposable Cups
- 10.2.3. Glass Bottles
- 10.2.4. Metal Can
- 10.2.5. PET Bottles
- 10.3. Market Analysis, Insights and Forecast - by Distribution Channel
- 10.3.1. Off-trade
- 10.3.1.1. Convenience Stores
- 10.3.1.2. Online Retail
- 10.3.1.3. Supermarket/Hypermarket
- 10.3.1.4. Others
- 10.3.2. On-trade
- 10.3.1. Off-trade
- 10.1. Market Analysis, Insights and Forecast - by Soft Drink Type
- 11. Competitive Analysis
- 11.1. Global Market Share Analysis 2025
- 11.2. Company Profiles
- 11.2.1 PepsiCo Inc
- 11.2.1.1. Overview
- 11.2.1.2. Products
- 11.2.1.3. SWOT Analysis
- 11.2.1.4. Recent Developments
- 11.2.1.5. Financials (Based on Availability)
- 11.2.2 Nongfu Spring Co Ltd
- 11.2.2.1. Overview
- 11.2.2.2. Products
- 11.2.2.3. SWOT Analysis
- 11.2.2.4. Recent Developments
- 11.2.2.5. Financials (Based on Availability)
- 11.2.3 Rauch Fruchtsäfte GmbH & Co OG
- 11.2.3.1. Overview
- 11.2.3.2. Products
- 11.2.3.3. SWOT Analysis
- 11.2.3.4. Recent Developments
- 11.2.3.5. Financials (Based on Availability)
- 11.2.4 Suntory Holdings Limited
- 11.2.4.1. Overview
- 11.2.4.2. Products
- 11.2.4.3. SWOT Analysis
- 11.2.4.4. Recent Developments
- 11.2.4.5. Financials (Based on Availability)
- 11.2.5 Keurig Dr Pepper Inc
- 11.2.5.1. Overview
- 11.2.5.2. Products
- 11.2.5.3. SWOT Analysis
- 11.2.5.4. Recent Developments
- 11.2.5.5. Financials (Based on Availability)
- 11.2.6 The Kraft Heinz Company
- 11.2.6.1. Overview
- 11.2.6.2. Products
- 11.2.6.3. SWOT Analysis
- 11.2.6.4. Recent Developments
- 11.2.6.5. Financials (Based on Availability)
- 11.2.7 Tingyi (Cayman Islands) Holding Corporation
- 11.2.7.1. Overview
- 11.2.7.2. Products
- 11.2.7.3. SWOT Analysis
- 11.2.7.4. Recent Developments
- 11.2.7.5. Financials (Based on Availability)
- 11.2.8 The Coca-Cola Company
- 11.2.8.1. Overview
- 11.2.8.2. Products
- 11.2.8.3. SWOT Analysis
- 11.2.8.4. Recent Developments
- 11.2.8.5. Financials (Based on Availability)
- 11.2.9 Uni-President Enterprises Corp
- 11.2.9.1. Overview
- 11.2.9.2. Products
- 11.2.9.3. SWOT Analysis
- 11.2.9.4. Recent Developments
- 11.2.9.5. Financials (Based on Availability)
- 11.2.10 Britvic PLC
- 11.2.10.1. Overview
- 11.2.10.2. Products
- 11.2.10.3. SWOT Analysis
- 11.2.10.4. Recent Developments
- 11.2.10.5. Financials (Based on Availability)
- 11.2.11 Tropicana Brands Group
- 11.2.11.1. Overview
- 11.2.11.2. Products
- 11.2.11.3. SWOT Analysis
- 11.2.11.4. Recent Developments
- 11.2.11.5. Financials (Based on Availability)
- 11.2.12 Thai Beverages PCL
- 11.2.12.1. Overview
- 11.2.12.2. Products
- 11.2.12.3. SWOT Analysis
- 11.2.12.4. Recent Developments
- 11.2.12.5. Financials (Based on Availability)
- 11.2.13 Eckes-Granini Group GmbH
- 11.2.13.1. Overview
- 11.2.13.2. Products
- 11.2.13.3. SWOT Analysis
- 11.2.13.4. Recent Developments
- 11.2.13.5. Financials (Based on Availability)
- 11.2.1 PepsiCo Inc
List of Figures
- Figure 1: Global Juices Market Revenue Breakdown (billion, %) by Region 2025 & 2033
- Figure 2: North America Juices Market Revenue (billion), by Soft Drink Type 2025 & 2033
- Figure 3: North America Juices Market Revenue Share (%), by Soft Drink Type 2025 & 2033
- Figure 4: North America Juices Market Revenue (billion), by Packaging Type 2025 & 2033
- Figure 5: North America Juices Market Revenue Share (%), by Packaging Type 2025 & 2033
- Figure 6: North America Juices Market Revenue (billion), by Distribution Channel 2025 & 2033
- Figure 7: North America Juices Market Revenue Share (%), by Distribution Channel 2025 & 2033
- Figure 8: North America Juices Market Revenue (billion), by Country 2025 & 2033
- Figure 9: North America Juices Market Revenue Share (%), by Country 2025 & 2033
- Figure 10: South America Juices Market Revenue (billion), by Soft Drink Type 2025 & 2033
- Figure 11: South America Juices Market Revenue Share (%), by Soft Drink Type 2025 & 2033
- Figure 12: South America Juices Market Revenue (billion), by Packaging Type 2025 & 2033
- Figure 13: South America Juices Market Revenue Share (%), by Packaging Type 2025 & 2033
- Figure 14: South America Juices Market Revenue (billion), by Distribution Channel 2025 & 2033
- Figure 15: South America Juices Market Revenue Share (%), by Distribution Channel 2025 & 2033
- Figure 16: South America Juices Market Revenue (billion), by Country 2025 & 2033
- Figure 17: South America Juices Market Revenue Share (%), by Country 2025 & 2033
- Figure 18: Europe Juices Market Revenue (billion), by Soft Drink Type 2025 & 2033
- Figure 19: Europe Juices Market Revenue Share (%), by Soft Drink Type 2025 & 2033
- Figure 20: Europe Juices Market Revenue (billion), by Packaging Type 2025 & 2033
- Figure 21: Europe Juices Market Revenue Share (%), by Packaging Type 2025 & 2033
- Figure 22: Europe Juices Market Revenue (billion), by Distribution Channel 2025 & 2033
- Figure 23: Europe Juices Market Revenue Share (%), by Distribution Channel 2025 & 2033
- Figure 24: Europe Juices Market Revenue (billion), by Country 2025 & 2033
- Figure 25: Europe Juices Market Revenue Share (%), by Country 2025 & 2033
- Figure 26: Middle East & Africa Juices Market Revenue (billion), by Soft Drink Type 2025 & 2033
- Figure 27: Middle East & Africa Juices Market Revenue Share (%), by Soft Drink Type 2025 & 2033
- Figure 28: Middle East & Africa Juices Market Revenue (billion), by Packaging Type 2025 & 2033
- Figure 29: Middle East & Africa Juices Market Revenue Share (%), by Packaging Type 2025 & 2033
- Figure 30: Middle East & Africa Juices Market Revenue (billion), by Distribution Channel 2025 & 2033
- Figure 31: Middle East & Africa Juices Market Revenue Share (%), by Distribution Channel 2025 & 2033
- Figure 32: Middle East & Africa Juices Market Revenue (billion), by Country 2025 & 2033
- Figure 33: Middle East & Africa Juices Market Revenue Share (%), by Country 2025 & 2033
- Figure 34: Asia Pacific Juices Market Revenue (billion), by Soft Drink Type 2025 & 2033
- Figure 35: Asia Pacific Juices Market Revenue Share (%), by Soft Drink Type 2025 & 2033
- Figure 36: Asia Pacific Juices Market Revenue (billion), by Packaging Type 2025 & 2033
- Figure 37: Asia Pacific Juices Market Revenue Share (%), by Packaging Type 2025 & 2033
- Figure 38: Asia Pacific Juices Market Revenue (billion), by Distribution Channel 2025 & 2033
- Figure 39: Asia Pacific Juices Market Revenue Share (%), by Distribution Channel 2025 & 2033
- Figure 40: Asia Pacific Juices Market Revenue (billion), by Country 2025 & 2033
- Figure 41: Asia Pacific Juices Market Revenue Share (%), by Country 2025 & 2033
List of Tables
- Table 1: Global Juices Market Revenue billion Forecast, by Soft Drink Type 2020 & 2033
- Table 2: Global Juices Market Revenue billion Forecast, by Packaging Type 2020 & 2033
- Table 3: Global Juices Market Revenue billion Forecast, by Distribution Channel 2020 & 2033
- Table 4: Global Juices Market Revenue billion Forecast, by Region 2020 & 2033
- Table 5: Global Juices Market Revenue billion Forecast, by Soft Drink Type 2020 & 2033
- Table 6: Global Juices Market Revenue billion Forecast, by Packaging Type 2020 & 2033
- Table 7: Global Juices Market Revenue billion Forecast, by Distribution Channel 2020 & 2033
- Table 8: Global Juices Market Revenue billion Forecast, by Country 2020 & 2033
- Table 9: United States Juices Market Revenue (billion) Forecast, by Application 2020 & 2033
- Table 10: Canada Juices Market Revenue (billion) Forecast, by Application 2020 & 2033
- Table 11: Mexico Juices Market Revenue (billion) Forecast, by Application 2020 & 2033
- Table 12: Global Juices Market Revenue billion Forecast, by Soft Drink Type 2020 & 2033
- Table 13: Global Juices Market Revenue billion Forecast, by Packaging Type 2020 & 2033
- Table 14: Global Juices Market Revenue billion Forecast, by Distribution Channel 2020 & 2033
- Table 15: Global Juices Market Revenue billion Forecast, by Country 2020 & 2033
- Table 16: Brazil Juices Market Revenue (billion) Forecast, by Application 2020 & 2033
- Table 17: Argentina Juices Market Revenue (billion) Forecast, by Application 2020 & 2033
- Table 18: Rest of South America Juices Market Revenue (billion) Forecast, by Application 2020 & 2033
- Table 19: Global Juices Market Revenue billion Forecast, by Soft Drink Type 2020 & 2033
- Table 20: Global Juices Market Revenue billion Forecast, by Packaging Type 2020 & 2033
- Table 21: Global Juices Market Revenue billion Forecast, by Distribution Channel 2020 & 2033
- Table 22: Global Juices Market Revenue billion Forecast, by Country 2020 & 2033
- Table 23: United Kingdom Juices Market Revenue (billion) Forecast, by Application 2020 & 2033
- Table 24: Germany Juices Market Revenue (billion) Forecast, by Application 2020 & 2033
- Table 25: France Juices Market Revenue (billion) Forecast, by Application 2020 & 2033
- Table 26: Italy Juices Market Revenue (billion) Forecast, by Application 2020 & 2033
- Table 27: Spain Juices Market Revenue (billion) Forecast, by Application 2020 & 2033
- Table 28: Russia Juices Market Revenue (billion) Forecast, by Application 2020 & 2033
- Table 29: Benelux Juices Market Revenue (billion) Forecast, by Application 2020 & 2033
- Table 30: Nordics Juices Market Revenue (billion) Forecast, by Application 2020 & 2033
- Table 31: Rest of Europe Juices Market Revenue (billion) Forecast, by Application 2020 & 2033
- Table 32: Global Juices Market Revenue billion Forecast, by Soft Drink Type 2020 & 2033
- Table 33: Global Juices Market Revenue billion Forecast, by Packaging Type 2020 & 2033
- Table 34: Global Juices Market Revenue billion Forecast, by Distribution Channel 2020 & 2033
- Table 35: Global Juices Market Revenue billion Forecast, by Country 2020 & 2033
- Table 36: Turkey Juices Market Revenue (billion) Forecast, by Application 2020 & 2033
- Table 37: Israel Juices Market Revenue (billion) Forecast, by Application 2020 & 2033
- Table 38: GCC Juices Market Revenue (billion) Forecast, by Application 2020 & 2033
- Table 39: North Africa Juices Market Revenue (billion) Forecast, by Application 2020 & 2033
- Table 40: South Africa Juices Market Revenue (billion) Forecast, by Application 2020 & 2033
- Table 41: Rest of Middle East & Africa Juices Market Revenue (billion) Forecast, by Application 2020 & 2033
- Table 42: Global Juices Market Revenue billion Forecast, by Soft Drink Type 2020 & 2033
- Table 43: Global Juices Market Revenue billion Forecast, by Packaging Type 2020 & 2033
- Table 44: Global Juices Market Revenue billion Forecast, by Distribution Channel 2020 & 2033
- Table 45: Global Juices Market Revenue billion Forecast, by Country 2020 & 2033
- Table 46: China Juices Market Revenue (billion) Forecast, by Application 2020 & 2033
- Table 47: India Juices Market Revenue (billion) Forecast, by Application 2020 & 2033
- Table 48: Japan Juices Market Revenue (billion) Forecast, by Application 2020 & 2033
- Table 49: South Korea Juices Market Revenue (billion) Forecast, by Application 2020 & 2033
- Table 50: ASEAN Juices Market Revenue (billion) Forecast, by Application 2020 & 2033
- Table 51: Oceania Juices Market Revenue (billion) Forecast, by Application 2020 & 2033
- Table 52: Rest of Asia Pacific Juices Market Revenue (billion) Forecast, by Application 2020 & 2033
Frequently Asked Questions
1. What is the projected Compound Annual Growth Rate (CAGR) of the Juices Market?
The projected CAGR is approximately 4.31%.
2. Which companies are prominent players in the Juices Market?
Key companies in the market include PepsiCo Inc, Nongfu Spring Co Ltd, Rauch Fruchtsäfte GmbH & Co OG, Suntory Holdings Limited, Keurig Dr Pepper Inc, The Kraft Heinz Company, Tingyi (Cayman Islands) Holding Corporation, The Coca-Cola Company, Uni-President Enterprises Corp, Britvic PLC, Tropicana Brands Group, Thai Beverages PCL, Eckes-Granini Group GmbH.
3. What are the main segments of the Juices Market?
The market segments include Soft Drink Type, Packaging Type, Distribution Channel.
4. Can you provide details about the market size?
The market size is estimated to be USD 159.1 billion as of 2022.
5. What are some drivers contributing to market growth?
Increasing Demand for Supplement Nutrition; Growing Casein Application in Processed Food Products.
6. What are the notable trends driving market growth?
OTHER KEY INDUSTRY TRENDS COVERED IN THE REPORT.
7. Are there any restraints impacting market growth?
Competition from Vegan/Plant-based Protein Powders.
8. Can you provide examples of recent developments in the market?
June 2023: Capri-Sun launched new Jungle Drink in 6 flavours including Guava, Pineapple, Passionfruit, Orange & Lemon.February 2023: Capri Sun announced to takeover their sales and distribution of pouch fruit juice drinks from Coca Cola in France, Monaco, Great Britain, Netherlands, Belgium, Luxemburg, Sweden, Spain, and Portugal by 2024.July 2022: Capri Sun has reduced the addedsugar content by 40% using monk fruit juice. They have reduced 8gm sugar to 5gm in each pouch.
9. What pricing options are available for accessing the report?
Pricing options include single-user, multi-user, and enterprise licenses priced at USD 3800, USD 4500, and USD 5800 respectively.
10. Is the market size provided in terms of value or volume?
The market size is provided in terms of value, measured in billion.
11. Are there any specific market keywords associated with the report?
Yes, the market keyword associated with the report is "Juices Market," which aids in identifying and referencing the specific market segment covered.
12. How do I determine which pricing option suits my needs best?
The pricing options vary based on user requirements and access needs. Individual users may opt for single-user licenses, while businesses requiring broader access may choose multi-user or enterprise licenses for cost-effective access to the report.
13. Are there any additional resources or data provided in the Juices Market report?
While the report offers comprehensive insights, it's advisable to review the specific contents or supplementary materials provided to ascertain if additional resources or data are available.
14. How can I stay updated on further developments or reports in the Juices Market?
To stay informed about further developments, trends, and reports in the Juices Market, consider subscribing to industry newsletters, following relevant companies and organizations, or regularly checking reputable industry news sources and publications.
Methodology
Step 1 - Identification of Relevant Samples Size from Population Database


Step 2 - Approaches for Defining Global Market Size (Value, Volume* & Price*)

Note*: In applicable scenarios
Step 3 - Data Sources
Primary Research
- Web Analytics
- Survey Reports
- Research Institute
- Latest Research Reports
- Opinion Leaders
Secondary Research
- Annual Reports
- White Paper
- Latest Press Release
- Industry Association
- Paid Database
- Investor Presentations

Step 4 - Data Triangulation
Involves using different sources of information in order to increase the validity of a study
These sources are likely to be stakeholders in a program - participants, other researchers, program staff, other community members, and so on.
Then we put all data in single framework & apply various statistical tools to find out the dynamic on the market.
During the analysis stage, feedback from the stakeholder groups would be compared to determine areas of agreement as well as areas of divergence
