

Key Insights
The North American food service market, encompassing cafes, bars, quick-service restaurants (QSRs), and other dining establishments, is a dynamic and substantial sector. Driven by rising disposable incomes, evolving consumer preferences for convenience and diverse culinary experiences, and the increasing popularity of food delivery, the market is projected for robust expansion. The Compound Annual Growth Rate (CAGR) is estimated at 11.98% from 2025 to 2033. The market size for 2025 is projected at 4885.4 million. Growth is further propelled by the dominance of chained outlets alongside a strong presence of independent establishments. Geographic distribution reveals a blend of urban and suburban dynamics, with the United States holding a considerable share, followed by Canada and Mexico. Emerging trends such as ghost kitchens, sustainable practices, and demand for healthier, customized options are shaping future market development.
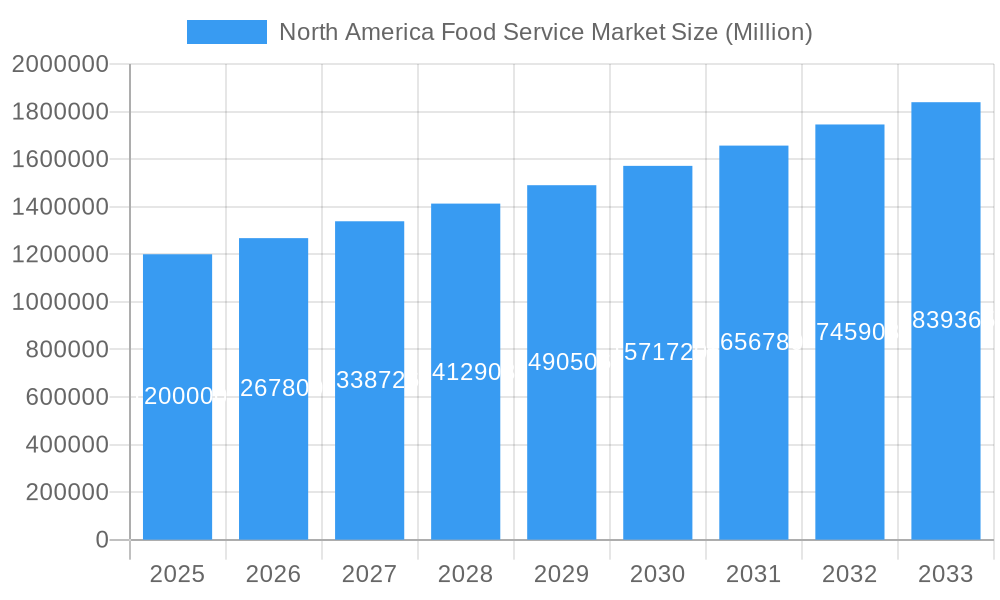
North America Food Service Market Market Size (In Billion)
The sector faces constraints including fluctuating commodity prices, rising labor costs, and intense competition. Continuous innovation and efficiency improvements are essential. The QSR segment significantly contributes to overall market growth due to its affordability and accessibility. Cafes and bars attract a different consumer base, generating substantial revenue with potentially slower growth. Market leaders like McDonald's, Starbucks, and Yum! Brands exert strong influence, yet smaller chains and independent establishments thrive through localized menus and unique offerings. Future growth hinges on navigating challenges and capitalizing on emerging opportunities through technological adoption, data analytics for menu optimization, and sustainable sourcing strategies.
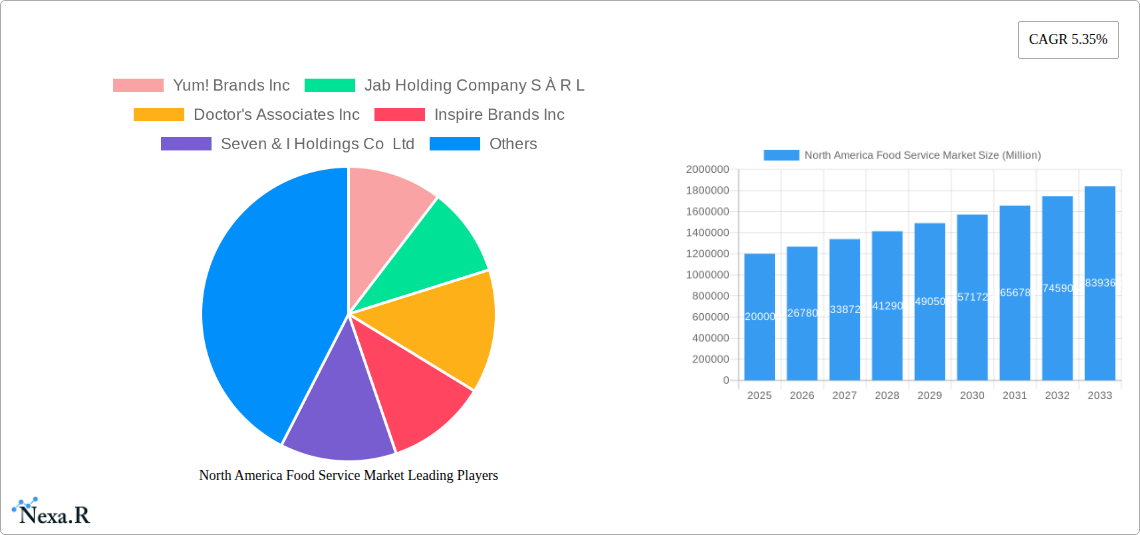
North America Food Service Market Company Market Share
North America Food Service Market: A Comprehensive Report (2019-2033)
This comprehensive report provides an in-depth analysis of the North America food service market, encompassing its current state, future trends, and key players. With a detailed examination of market segments, including chained and independent outlets, various locations (leisure, lodging, retail, standalone, travel), and food service types (cafés & bars, other QSR cuisines), this report is an essential resource for industry professionals, investors, and strategic planners. The study period covers 2019-2033, with a base year of 2025 and a forecast period of 2025-2033.
North America Food Service Market Dynamics & Structure
The North American food service market is a dynamic landscape characterized by intense competition, rapid technological advancements, and evolving consumer preferences. Market concentration is moderate, with a few large players dominating certain segments while numerous smaller independent outlets contribute significantly to the overall market size. Technological innovations, such as online ordering, delivery platforms, and kitchen automation, are reshaping operational efficiencies and consumer experiences. Regulatory frameworks, varying by country and region, influence food safety, hygiene, and labor practices. The market witnesses continuous M&A activity, with larger chains acquiring smaller brands to expand their footprint and diversify offerings. Competitive substitutes, including meal kits and home-cooked meals, exert pressure on market growth. End-user demographics, with millennial and Gen Z consumers driving demand for diverse and experiential dining, are critical to market trends.
- Market Concentration: Moderately concentrated, with top 10 players holding approximately xx% market share (2024).
- M&A Activity: xx deals closed in 2024, with an average deal size of xx Million.
- Technological Innovation: Key drivers include online ordering systems, mobile payment options, and automated kitchen equipment.
- Regulatory Landscape: Varying food safety regulations and minimum wage laws across different states and provinces.
- Competitive Substitutes: Growing popularity of meal kits and home delivery services poses a challenge.
North America Food Service Market Growth Trends & Insights
The North America food service market experienced significant growth during the historical period (2019-2024), fueled by rising disposable incomes, urbanization, and changing lifestyles. The market size is projected to reach xx Million in 2025, exhibiting a CAGR of xx% during the forecast period (2025-2033). Technological disruptions, such as the rise of cloud kitchens and ghost kitchens, are transforming the industry's infrastructure. Consumer behavior shifts, including increased demand for healthy, sustainable, and ethically sourced food options, are shaping menu innovation and operational strategies. Premiumization and customization are gaining traction, with consumers willing to pay more for unique experiences and personalized offerings. Market penetration of online ordering and delivery services continues to rise, altering consumer expectations and driving the need for seamless digital integration.
Dominant Regions, Countries, or Segments in North America Food Service Market
The United States dominates the North America food service market, accounting for approximately xx% of the total market value in 2024, followed by Canada and Mexico. Within the United States, key growth drivers include robust economic conditions, a large and diverse population, and high consumer spending on food away from home. The chained outlet segment is the largest, representing xx% of the market in 2024, showcasing the dominance of established restaurant brands. The leisure location segment shows considerable growth potential due to increasing tourism and recreational activities.
- Dominant Country: United States (xx% market share in 2024).
- Dominant Outlet Type: Chained Outlets (xx% market share in 2024).
- Fastest-Growing Segment: Leisure Location (projected xx% CAGR 2025-2033).
- Key Growth Drivers (US): Strong economic growth, high disposable incomes, and diverse culinary preferences.
- Key Growth Drivers (Canada): Increasing tourism and a growing population in major urban areas.
North America Food Service Market Product Landscape
Product innovation in the North American food service market focuses on menu diversification, customization options, and technological integration. Restaurants are increasingly offering plant-based alternatives, healthier options, and personalized meal choices. Technological advancements, such as AI-powered recommendation systems and automated ordering kiosks, enhance the customer experience and operational efficiency. Unique selling propositions often center around sustainable practices, unique culinary experiences, and high-quality ingredients.
Key Drivers, Barriers & Challenges in North America Food Service Market
Key Drivers: Rising disposable incomes, evolving consumer preferences (healthier options, convenience), technological advancements (online ordering, delivery), and urbanization are driving market growth.
Key Challenges: Labor shortages, increasing food costs, supply chain disruptions, and intense competition contribute to operational challenges. Regulatory compliance regarding food safety and labor laws also adds complexity. Economic downturns can significantly impact consumer spending on food services.
Emerging Opportunities in North America Food Service Market
Emerging opportunities include the growth of ghost kitchens, the rising demand for personalized and customized food experiences, and the increasing focus on sustainable and ethically sourced ingredients. Untapped markets in rural areas and expansion into new culinary niches present further growth potential. The use of technology to enhance customer engagement, such as loyalty programs and personalized offers, is also a key opportunity.
Growth Accelerators in the North America Food Service Market Industry
Technological advancements, strategic partnerships (e.g., delivery platforms), and market expansion strategies (e.g., internationalization) are key catalysts for long-term growth. The increasing adoption of data analytics for optimizing operations and understanding customer preferences further contributes to market expansion.
Key Players Shaping the North America Food Service Market Market
- Yum! Brands Inc
- Jab Holding Company S À R L
- Doctor's Associates Inc
- Inspire Brands Inc
- Seven & I Holdings Co Ltd
- Brinker International Inc
- Darden Restaurants Inc
- The Wendy's Company
- Domino's Pizza Inc
- Starbucks Corporation
- Papa John's International Inc
- Restaurant Brands International Inc
- McDonald's Corporation
- Bloomin' Brands Inc
- Boston Pizza International Inc
Notable Milestones in North America Food Service Market Sector
- November 2022: Starbucks unveiled the new Starbucks Reserve Empire State Building store, showcasing innovative experiences and an extended artisan menu.
- December 2022: 7-Eleven expanded its Canadian footprint by converting restaurants into authorized outlets with fine dining seating.
- January 2023: Bloomin' Brands opened redesigned Outback Steakhouse stores in Spring's Grand Parkway Marketplace.
In-Depth North America Food Service Market Market Outlook
The North America food service market is poised for continued growth, driven by technological innovation, evolving consumer preferences, and strategic partnerships. Future market potential lies in leveraging data analytics, personalized offerings, and sustainable practices to enhance customer experience and operational efficiency. Strategic opportunities include expanding into untapped markets, focusing on niche culinary segments, and embracing innovative business models such as ghost kitchens and cloud kitchens. The market's long-term outlook remains positive, with significant growth potential across various segments and regions.
North America Food Service Market Segmentation
-
1. Foodservice Type
-
1.1. Cafes & Bars
-
1.1.1. By Cuisine
- 1.1.1.1. Bars & Pubs
- 1.1.1.2. Juice/Smoothie/Desserts Bars
- 1.1.1.3. Specialist Coffee & Tea Shops
-
1.1.1. By Cuisine
- 1.2. Cloud Kitchen
-
1.3. Full Service Restaurants
- 1.3.1. Asian
- 1.3.2. European
- 1.3.3. Latin American
- 1.3.4. Middle Eastern
- 1.3.5. North American
- 1.3.6. Other FSR Cuisines
-
1.4. Quick Service Restaurants
- 1.4.1. Bakeries
- 1.4.2. Burger
- 1.4.3. Ice Cream
- 1.4.4. Meat-based Cuisines
- 1.4.5. Pizza
- 1.4.6. Other QSR Cuisines
-
1.1. Cafes & Bars
-
2. Outlet
- 2.1. Chained Outlets
- 2.2. Independent Outlets
-
3. Location
- 3.1. Leisure
- 3.2. Lodging
- 3.3. Retail
- 3.4. Standalone
- 3.5. Travel
North America Food Service Market Segmentation By Geography
-
1. North America
- 1.1. United States
- 1.2. Canada
- 1.3. Mexico
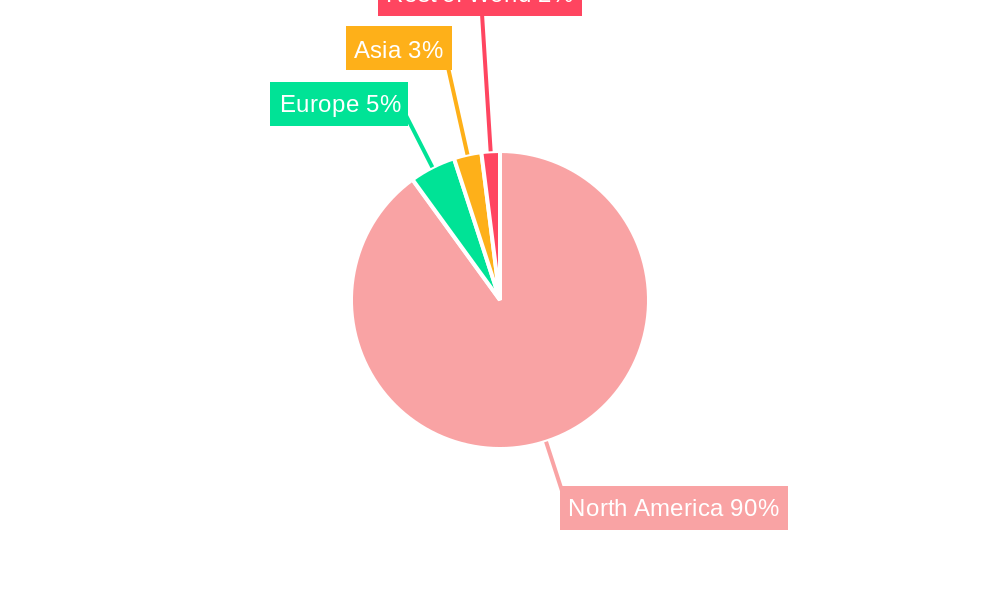
North America Food Service Market Regional Market Share
Geographic Coverage of North America Food Service Market
North America Food Service Market REPORT HIGHLIGHTS
| Aspects | Details |
|---|---|
| Study Period | 2020-2034 |
| Base Year | 2025 |
| Estimated Year | 2026 |
| Forecast Period | 2026-2034 |
| Historical Period | 2020-2025 |
| Growth Rate | CAGR of 11.98% from 2020-2034 |
| Segmentation |
|
Table of Contents
- 1. Introduction
- 1.1. Research Scope
- 1.2. Market Segmentation
- 1.3. Research Methodology
- 1.4. Definitions and Assumptions
- 2. Executive Summary
- 2.1. Introduction
- 3. Market Dynamics
- 3.1. Introduction
- 3.2. Market Drivers
- 3.2.1. Growing Inclination Towards Vegan/Plant-based Protein Sources; Increasing Demand for Functional Protein Beverages
- 3.3. Market Restrains
- 3.3.1. Competition from Substitute Products
- 3.4. Market Trends
- 3.4.1. OTHER KEY INDUSTRY TRENDS COVERED IN THE REPORT
- 4. Market Factor Analysis
- 4.1. Porters Five Forces
- 4.2. Supply/Value Chain
- 4.3. PESTEL analysis
- 4.4. Market Entropy
- 4.5. Patent/Trademark Analysis
- 5. North America Food Service Market Analysis, Insights and Forecast, 2020-2032
- 5.1. Market Analysis, Insights and Forecast - by Foodservice Type
- 5.1.1. Cafes & Bars
- 5.1.1.1. By Cuisine
- 5.1.1.1.1. Bars & Pubs
- 5.1.1.1.2. Juice/Smoothie/Desserts Bars
- 5.1.1.1.3. Specialist Coffee & Tea Shops
- 5.1.1.1. By Cuisine
- 5.1.2. Cloud Kitchen
- 5.1.3. Full Service Restaurants
- 5.1.3.1. Asian
- 5.1.3.2. European
- 5.1.3.3. Latin American
- 5.1.3.4. Middle Eastern
- 5.1.3.5. North American
- 5.1.3.6. Other FSR Cuisines
- 5.1.4. Quick Service Restaurants
- 5.1.4.1. Bakeries
- 5.1.4.2. Burger
- 5.1.4.3. Ice Cream
- 5.1.4.4. Meat-based Cuisines
- 5.1.4.5. Pizza
- 5.1.4.6. Other QSR Cuisines
- 5.1.1. Cafes & Bars
- 5.2. Market Analysis, Insights and Forecast - by Outlet
- 5.2.1. Chained Outlets
- 5.2.2. Independent Outlets
- 5.3. Market Analysis, Insights and Forecast - by Location
- 5.3.1. Leisure
- 5.3.2. Lodging
- 5.3.3. Retail
- 5.3.4. Standalone
- 5.3.5. Travel
- 5.4. Market Analysis, Insights and Forecast - by Region
- 5.4.1. North America
- 5.1. Market Analysis, Insights and Forecast - by Foodservice Type
- 6. Competitive Analysis
- 6.1. Market Share Analysis 2025
- 6.2. Company Profiles
- 6.2.1 Yum! Brands Inc
- 6.2.1.1. Overview
- 6.2.1.2. Products
- 6.2.1.3. SWOT Analysis
- 6.2.1.4. Recent Developments
- 6.2.1.5. Financials (Based on Availability)
- 6.2.2 Jab Holding Company S À R L
- 6.2.2.1. Overview
- 6.2.2.2. Products
- 6.2.2.3. SWOT Analysis
- 6.2.2.4. Recent Developments
- 6.2.2.5. Financials (Based on Availability)
- 6.2.3 Doctor's Associates Inc
- 6.2.3.1. Overview
- 6.2.3.2. Products
- 6.2.3.3. SWOT Analysis
- 6.2.3.4. Recent Developments
- 6.2.3.5. Financials (Based on Availability)
- 6.2.4 Inspire Brands Inc
- 6.2.4.1. Overview
- 6.2.4.2. Products
- 6.2.4.3. SWOT Analysis
- 6.2.4.4. Recent Developments
- 6.2.4.5. Financials (Based on Availability)
- 6.2.5 Seven & I Holdings Co Ltd
- 6.2.5.1. Overview
- 6.2.5.2. Products
- 6.2.5.3. SWOT Analysis
- 6.2.5.4. Recent Developments
- 6.2.5.5. Financials (Based on Availability)
- 6.2.6 Brinker International Inc
- 6.2.6.1. Overview
- 6.2.6.2. Products
- 6.2.6.3. SWOT Analysis
- 6.2.6.4. Recent Developments
- 6.2.6.5. Financials (Based on Availability)
- 6.2.7 Darden Restaurants Inc
- 6.2.7.1. Overview
- 6.2.7.2. Products
- 6.2.7.3. SWOT Analysis
- 6.2.7.4. Recent Developments
- 6.2.7.5. Financials (Based on Availability)
- 6.2.8 The Wendy's Company
- 6.2.8.1. Overview
- 6.2.8.2. Products
- 6.2.8.3. SWOT Analysis
- 6.2.8.4. Recent Developments
- 6.2.8.5. Financials (Based on Availability)
- 6.2.9 Domino's Pizza Inc
- 6.2.9.1. Overview
- 6.2.9.2. Products
- 6.2.9.3. SWOT Analysis
- 6.2.9.4. Recent Developments
- 6.2.9.5. Financials (Based on Availability)
- 6.2.10 Starbucks Corporation
- 6.2.10.1. Overview
- 6.2.10.2. Products
- 6.2.10.3. SWOT Analysis
- 6.2.10.4. Recent Developments
- 6.2.10.5. Financials (Based on Availability)
- 6.2.11 Papa John's International Inc
- 6.2.11.1. Overview
- 6.2.11.2. Products
- 6.2.11.3. SWOT Analysis
- 6.2.11.4. Recent Developments
- 6.2.11.5. Financials (Based on Availability)
- 6.2.12 Restaurant Brands International Inc
- 6.2.12.1. Overview
- 6.2.12.2. Products
- 6.2.12.3. SWOT Analysis
- 6.2.12.4. Recent Developments
- 6.2.12.5. Financials (Based on Availability)
- 6.2.13 McDonald's Corporation
- 6.2.13.1. Overview
- 6.2.13.2. Products
- 6.2.13.3. SWOT Analysis
- 6.2.13.4. Recent Developments
- 6.2.13.5. Financials (Based on Availability)
- 6.2.14 Bloomin' Brands Inc
- 6.2.14.1. Overview
- 6.2.14.2. Products
- 6.2.14.3. SWOT Analysis
- 6.2.14.4. Recent Developments
- 6.2.14.5. Financials (Based on Availability)
- 6.2.15 Boston Pizza International Inc
- 6.2.15.1. Overview
- 6.2.15.2. Products
- 6.2.15.3. SWOT Analysis
- 6.2.15.4. Recent Developments
- 6.2.15.5. Financials (Based on Availability)
- 6.2.1 Yum! Brands Inc
List of Figures
- Figure 1: North America Food Service Market Revenue Breakdown (million, %) by Product 2025 & 2033
- Figure 2: North America Food Service Market Share (%) by Company 2025
List of Tables
- Table 1: North America Food Service Market Revenue million Forecast, by Foodservice Type 2020 & 2033
- Table 2: North America Food Service Market Revenue million Forecast, by Outlet 2020 & 2033
- Table 3: North America Food Service Market Revenue million Forecast, by Location 2020 & 2033
- Table 4: North America Food Service Market Revenue million Forecast, by Region 2020 & 2033
- Table 5: North America Food Service Market Revenue million Forecast, by Foodservice Type 2020 & 2033
- Table 6: North America Food Service Market Revenue million Forecast, by Outlet 2020 & 2033
- Table 7: North America Food Service Market Revenue million Forecast, by Location 2020 & 2033
- Table 8: North America Food Service Market Revenue million Forecast, by Country 2020 & 2033
- Table 9: United States North America Food Service Market Revenue (million) Forecast, by Application 2020 & 2033
- Table 10: Canada North America Food Service Market Revenue (million) Forecast, by Application 2020 & 2033
- Table 11: Mexico North America Food Service Market Revenue (million) Forecast, by Application 2020 & 2033
Frequently Asked Questions
1. What is the projected Compound Annual Growth Rate (CAGR) of the North America Food Service Market?
The projected CAGR is approximately 11.98%.
2. Which companies are prominent players in the North America Food Service Market?
Key companies in the market include Yum! Brands Inc, Jab Holding Company S À R L, Doctor's Associates Inc, Inspire Brands Inc, Seven & I Holdings Co Ltd, Brinker International Inc, Darden Restaurants Inc, The Wendy's Company, Domino's Pizza Inc, Starbucks Corporation, Papa John's International Inc, Restaurant Brands International Inc, McDonald's Corporation, Bloomin' Brands Inc, Boston Pizza International Inc.
3. What are the main segments of the North America Food Service Market?
The market segments include Foodservice Type, Outlet, Location.
4. Can you provide details about the market size?
The market size is estimated to be USD 4885.4 million as of 2022.
5. What are some drivers contributing to market growth?
Growing Inclination Towards Vegan/Plant-based Protein Sources; Increasing Demand for Functional Protein Beverages.
6. What are the notable trends driving market growth?
OTHER KEY INDUSTRY TRENDS COVERED IN THE REPORT.
7. Are there any restraints impacting market growth?
Competition from Substitute Products.
8. Can you provide examples of recent developments in the market?
January 2023: Bloomin' Brands declared that its brand Outback Steakhouse opened its redesigned stores in Spring's Grand Parkway Marketplace.December 2022: 7-Eleven announced that it started increasing its footprint in Canada by converting a number of its restaurants into authorized outlets with fine dining seating.November 2022: Starbucks unveiled the new Starbucks Reserve Empire State Building store. This unique store celebrates connecting over coffee through innovative experiences such as immersive, hands-on workshops, guided tasting flights, and new coffee beverages and craft cocktails. An extended artisan menu of Princi food is only available at this location.
9. What pricing options are available for accessing the report?
Pricing options include single-user, multi-user, and enterprise licenses priced at USD 3800, USD 4500, and USD 5800 respectively.
10. Is the market size provided in terms of value or volume?
The market size is provided in terms of value, measured in million.
11. Are there any specific market keywords associated with the report?
Yes, the market keyword associated with the report is "North America Food Service Market," which aids in identifying and referencing the specific market segment covered.
12. How do I determine which pricing option suits my needs best?
The pricing options vary based on user requirements and access needs. Individual users may opt for single-user licenses, while businesses requiring broader access may choose multi-user or enterprise licenses for cost-effective access to the report.
13. Are there any additional resources or data provided in the North America Food Service Market report?
While the report offers comprehensive insights, it's advisable to review the specific contents or supplementary materials provided to ascertain if additional resources or data are available.
14. How can I stay updated on further developments or reports in the North America Food Service Market?
To stay informed about further developments, trends, and reports in the North America Food Service Market, consider subscribing to industry newsletters, following relevant companies and organizations, or regularly checking reputable industry news sources and publications.
Methodology
Step 1 - Identification of Relevant Samples Size from Population Database


Step 2 - Approaches for Defining Global Market Size (Value, Volume* & Price*)

Note*: In applicable scenarios
Step 3 - Data Sources
Primary Research
- Web Analytics
- Survey Reports
- Research Institute
- Latest Research Reports
- Opinion Leaders
Secondary Research
- Annual Reports
- White Paper
- Latest Press Release
- Industry Association
- Paid Database
- Investor Presentations

Step 4 - Data Triangulation
Involves using different sources of information in order to increase the validity of a study
These sources are likely to be stakeholders in a program - participants, other researchers, program staff, other community members, and so on.
Then we put all data in single framework & apply various statistical tools to find out the dynamic on the market.
During the analysis stage, feedback from the stakeholder groups would be compared to determine areas of agreement as well as areas of divergence