

Key Insights
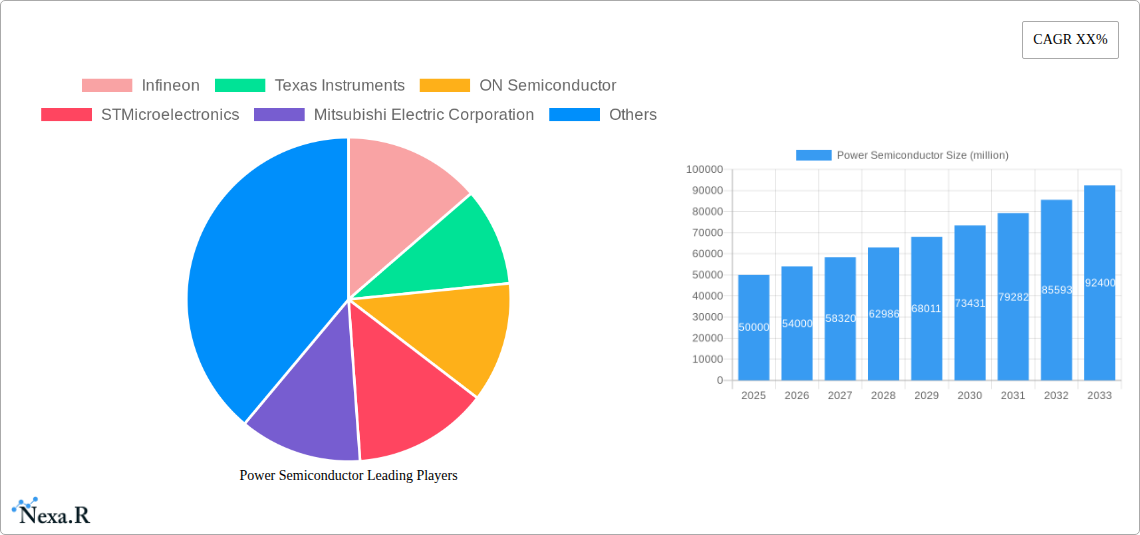
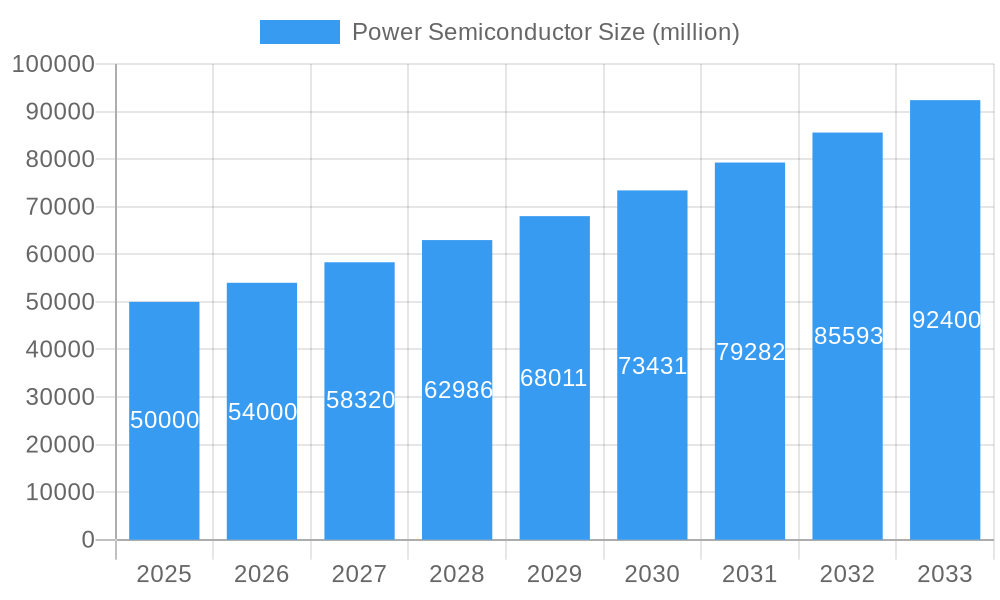
The power semiconductor market is experiencing robust growth, driven by the increasing demand for electric vehicles (EVs), renewable energy infrastructure, and advanced power management systems in consumer electronics and industrial automation. The market, estimated at $50 billion in 2025, is projected to exhibit a Compound Annual Growth Rate (CAGR) of 8% from 2025 to 2033, reaching approximately $95 billion by 2033. This growth is fueled by several key factors. Firstly, the global shift towards sustainable energy solutions is significantly boosting the demand for power semiconductors in solar inverters, wind turbines, and charging stations for EVs. Secondly, the proliferation of data centers and the ongoing development of 5G networks require efficient power management solutions, further driving market expansion. Thirdly, the increasing adoption of high-power density applications in industrial automation and robotics is also contributing to market growth. Major players like Infineon, Texas Instruments, and ON Semiconductor are strategically investing in research and development to enhance efficiency, reduce costs, and broaden their product portfolios to capitalize on this burgeoning market.
Power Semiconductor Market Size (In Billion)
However, the market faces challenges. Supply chain disruptions and the increasing complexity of semiconductor manufacturing processes present significant restraints. Furthermore, fluctuations in raw material prices and geopolitical uncertainties can impact production costs and market stability. Nevertheless, the long-term growth prospects remain positive, driven by ongoing technological advancements, such as the adoption of wide bandgap semiconductors (SiC and GaN), which offer superior performance and efficiency compared to traditional silicon-based devices. Market segmentation continues to evolve, with significant growth expected in high-power applications and specialized niche markets. Competitive pressures remain intense, prompting manufacturers to pursue strategic alliances, mergers, and acquisitions to secure market share and enhance their technological capabilities.
Power Semiconductor Company Market Share
Power Semiconductor Market Report: 2019-2033
This comprehensive report provides an in-depth analysis of the power semiconductor market, encompassing market dynamics, growth trends, regional dominance, product landscape, key players, and future outlook. The study period covers 2019-2033, with 2025 as the base and estimated year. The forecast period extends from 2025 to 2033, and the historical period analyzed is 2019-2024. This report is invaluable for industry professionals, investors, and strategists seeking to understand and capitalize on opportunities within this rapidly evolving market. The report also breaks down parent and child market segments for more precise analysis and forecasting.
Power Semiconductor Market Dynamics & Structure
The power semiconductor market is characterized by moderate concentration, with key players like Infineon, Texas Instruments, and ON Semiconductor holding significant market share. The market is driven by technological innovations such as SiC and GaN technologies, alongside increasing demand from electric vehicles (EVs), renewable energy, and industrial automation. Stringent regulatory frameworks concerning energy efficiency further propel market growth. Competitive product substitutes, such as alternative energy sources, pose a challenge, but the overall market shows robust growth. Mergers and acquisitions (M&A) activities are frequent, reflecting consolidation trends and technological advancements.
- Market Concentration: Moderately concentrated, with the top 5 players holding approximately xx% of the market share in 2024.
- Technological Innovation: SiC and GaN adoption driving efficiency gains and higher power density.
- Regulatory Frameworks: Stringent energy efficiency regulations in various regions.
- Competitive Substitutes: Alternative energy technologies and passive components.
- End-User Demographics: Dominated by automotive, industrial, and renewable energy sectors.
- M&A Trends: Significant M&A activity observed in the past five years, with approximately xx deals valued at xx million USD.
Power Semiconductor Growth Trends & Insights
The power semiconductor market experienced robust growth during the historical period (2019-2024), driven by increasing demand from the automotive, industrial, and renewable energy sectors. The market size is projected to reach xx million units by 2025, exhibiting a Compound Annual Growth Rate (CAGR) of xx% from 2025 to 2033. The adoption of SiC and GaN is accelerating, leading to higher power density and improved efficiency in various applications. Consumer preference for energy-efficient products and technological advancements continues to support market expansion. Key factors driving growth include rising demand for EVs, the expansion of renewable energy infrastructure, and ongoing industrial automation.
Dominant Regions, Countries, or Segments in Power Semiconductor
North America and Asia (particularly China and Japan) are the leading regions for power semiconductor market growth. Strong governmental support for renewable energy initiatives and the flourishing automotive industry in these regions fuel demand. Europe also displays strong growth due to the increasing adoption of sustainable energy solutions and stringent environmental regulations. The automotive segment leads the overall market, driven by electric vehicle adoption and the stringent fuel efficiency standards.
- North America: Strong growth due to the large automotive and industrial sectors.
- Asia: High demand driven by rapid industrialization and the expanding EV market, especially in China.
- Europe: Significant growth driven by strong environmental regulations and the transition to sustainable energy.
- Automotive Segment: Dominates market share with increasing demand for electric vehicles and hybrid electric vehicles.
Power Semiconductor Product Landscape
The power semiconductor market encompasses a wide range of products, including diodes, transistors, thyristors, and integrated circuits (ICs). Recent innovations focus on enhancing efficiency, power density, and thermal management. SiC and GaN-based devices are gaining traction due to their superior performance characteristics. These advancements are driving adoption in high-performance applications, such as electric vehicles, solar inverters, and industrial motor drives. Key selling propositions include improved energy efficiency, reduced size and weight, and enhanced reliability.
Key Drivers, Barriers & Challenges in Power Semiconductor
Key Drivers:
- Growing demand for electric vehicles and renewable energy infrastructure.
- Increasing adoption of energy-efficient technologies across various industries.
- Stringent government regulations promoting energy efficiency.
Challenges & Restraints:
- Supply chain disruptions impacting the availability of raw materials.
- High manufacturing costs associated with advanced technologies like SiC and GaN.
- Intense competition among established and emerging players.
Emerging Opportunities in Power Semiconductor
Emerging opportunities lie in the growing adoption of renewable energy technologies, including solar power and wind energy. The increasing demand for high-efficiency power converters in data centers and 5G infrastructure also presents significant growth potential. The development of innovative applications for SiC and GaN power semiconductors is creating new avenues for expansion. Untapped markets in developing economies also offer significant growth opportunities.
Growth Accelerators in the Power Semiconductor Industry
Technological breakthroughs in wide bandgap semiconductors (SiC and GaN) are key catalysts for growth. Strategic partnerships between manufacturers and end-users are facilitating innovation and market penetration. Aggressive market expansion strategies by leading players, focusing on emerging applications and geographical regions, are further driving market growth. The ongoing electrification of various sectors will continue to create demand for power semiconductors in the long term.
Key Players Shaping the Power Semiconductor Market
Notable Milestones in Power Semiconductor Sector
- 2020: Infineon launches a new generation of SiC MOSFETs.
- 2021: Texas Instruments announces a major investment in GaN technology.
- 2022: STMicroelectronics and ON Semiconductor form a strategic partnership.
- 2023: Several key players announce significant capacity expansions for SiC and GaN manufacturing.
In-Depth Power Semiconductor Market Outlook
The power semiconductor market is poised for sustained growth driven by the ongoing electrification of transportation, industrial automation, and the expansion of renewable energy. Strategic partnerships, technological innovations, and the increasing demand from emerging markets present significant opportunities. The market's long-term potential is substantial, with growth projected to be driven by continued adoption of high-efficiency devices and the integration of power semiconductors into emerging technologies.
Power Semiconductor Segmentation
-
1. Application
- 1.1. Industrial
- 1.2. Automobile
- 1.3. Communication
- 1.4. Consumer Electronics
-
2. Types
- 2.1. Power Semiconductor Device
- 2.2. Power Module
- 2.3. Power Integrated Circuits
Power Semiconductor Segmentation By Geography
-
1. North America
- 1.1. United States
- 1.2. Canada
- 1.3. Mexico
-
2. South America
- 2.1. Brazil
- 2.2. Argentina
- 2.3. Rest of South America
-
3. Europe
- 3.1. United Kingdom
- 3.2. Germany
- 3.3. France
- 3.4. Italy
- 3.5. Spain
- 3.6. Russia
- 3.7. Benelux
- 3.8. Nordics
- 3.9. Rest of Europe
-
4. Middle East & Africa
- 4.1. Turkey
- 4.2. Israel
- 4.3. GCC
- 4.4. North Africa
- 4.5. South Africa
- 4.6. Rest of Middle East & Africa
-
5. Asia Pacific
- 5.1. China
- 5.2. India
- 5.3. Japan
- 5.4. South Korea
- 5.5. ASEAN
- 5.6. Oceania
- 5.7. Rest of Asia Pacific
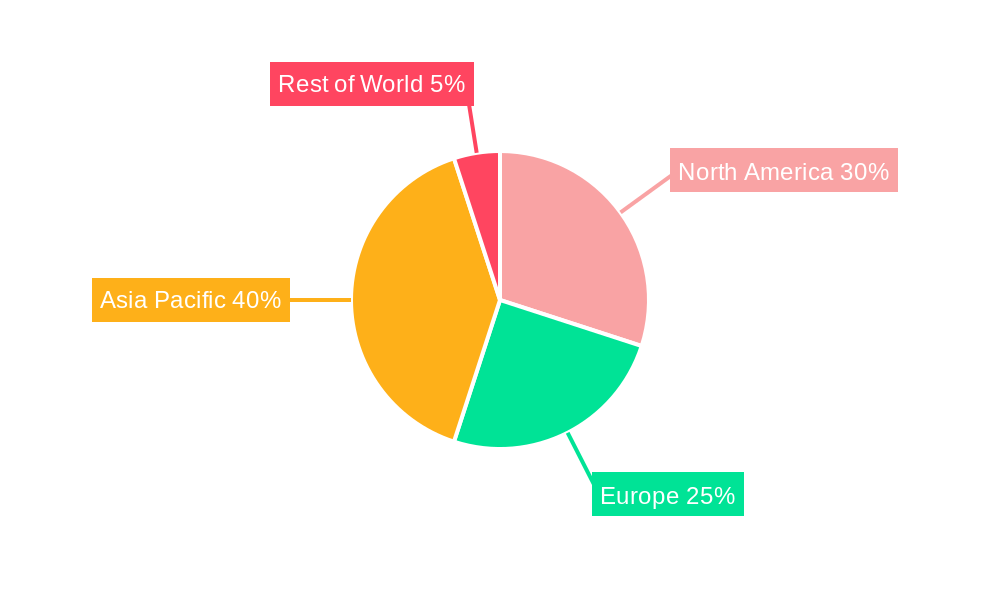
Power Semiconductor Regional Market Share
Geographic Coverage of Power Semiconductor
Power Semiconductor REPORT HIGHLIGHTS
| Aspects | Details |
|---|---|
| Study Period | 2020-2034 |
| Base Year | 2025 |
| Estimated Year | 2026 |
| Forecast Period | 2026-2034 |
| Historical Period | 2020-2025 |
| Growth Rate | CAGR of XX% from 2020-2034 |
| Segmentation |
|
Table of Contents
- 1. Introduction
- 1.1. Research Scope
- 1.2. Market Segmentation
- 1.3. Research Methodology
- 1.4. Definitions and Assumptions
- 2. Executive Summary
- 2.1. Introduction
- 3. Market Dynamics
- 3.1. Introduction
- 3.2. Market Drivers
- 3.3. Market Restrains
- 3.4. Market Trends
- 4. Market Factor Analysis
- 4.1. Porters Five Forces
- 4.2. Supply/Value Chain
- 4.3. PESTEL analysis
- 4.4. Market Entropy
- 4.5. Patent/Trademark Analysis
- 5. Global Power Semiconductor Analysis, Insights and Forecast, 2020-2032
- 5.1. Market Analysis, Insights and Forecast - by Application
- 5.1.1. Industrial
- 5.1.2. Automobile
- 5.1.3. Communication
- 5.1.4. Consumer Electronics
- 5.2. Market Analysis, Insights and Forecast - by Types
- 5.2.1. Power Semiconductor Device
- 5.2.2. Power Module
- 5.2.3. Power Integrated Circuits
- 5.3. Market Analysis, Insights and Forecast - by Region
- 5.3.1. North America
- 5.3.2. South America
- 5.3.3. Europe
- 5.3.4. Middle East & Africa
- 5.3.5. Asia Pacific
- 5.1. Market Analysis, Insights and Forecast - by Application
- 6. North America Power Semiconductor Analysis, Insights and Forecast, 2020-2032
- 6.1. Market Analysis, Insights and Forecast - by Application
- 6.1.1. Industrial
- 6.1.2. Automobile
- 6.1.3. Communication
- 6.1.4. Consumer Electronics
- 6.2. Market Analysis, Insights and Forecast - by Types
- 6.2.1. Power Semiconductor Device
- 6.2.2. Power Module
- 6.2.3. Power Integrated Circuits
- 6.1. Market Analysis, Insights and Forecast - by Application
- 7. South America Power Semiconductor Analysis, Insights and Forecast, 2020-2032
- 7.1. Market Analysis, Insights and Forecast - by Application
- 7.1.1. Industrial
- 7.1.2. Automobile
- 7.1.3. Communication
- 7.1.4. Consumer Electronics
- 7.2. Market Analysis, Insights and Forecast - by Types
- 7.2.1. Power Semiconductor Device
- 7.2.2. Power Module
- 7.2.3. Power Integrated Circuits
- 7.1. Market Analysis, Insights and Forecast - by Application
- 8. Europe Power Semiconductor Analysis, Insights and Forecast, 2020-2032
- 8.1. Market Analysis, Insights and Forecast - by Application
- 8.1.1. Industrial
- 8.1.2. Automobile
- 8.1.3. Communication
- 8.1.4. Consumer Electronics
- 8.2. Market Analysis, Insights and Forecast - by Types
- 8.2.1. Power Semiconductor Device
- 8.2.2. Power Module
- 8.2.3. Power Integrated Circuits
- 8.1. Market Analysis, Insights and Forecast - by Application
- 9. Middle East & Africa Power Semiconductor Analysis, Insights and Forecast, 2020-2032
- 9.1. Market Analysis, Insights and Forecast - by Application
- 9.1.1. Industrial
- 9.1.2. Automobile
- 9.1.3. Communication
- 9.1.4. Consumer Electronics
- 9.2. Market Analysis, Insights and Forecast - by Types
- 9.2.1. Power Semiconductor Device
- 9.2.2. Power Module
- 9.2.3. Power Integrated Circuits
- 9.1. Market Analysis, Insights and Forecast - by Application
- 10. Asia Pacific Power Semiconductor Analysis, Insights and Forecast, 2020-2032
- 10.1. Market Analysis, Insights and Forecast - by Application
- 10.1.1. Industrial
- 10.1.2. Automobile
- 10.1.3. Communication
- 10.1.4. Consumer Electronics
- 10.2. Market Analysis, Insights and Forecast - by Types
- 10.2.1. Power Semiconductor Device
- 10.2.2. Power Module
- 10.2.3. Power Integrated Circuits
- 10.1. Market Analysis, Insights and Forecast - by Application
- 11. Competitive Analysis
- 11.1. Global Market Share Analysis 2025
- 11.2. Company Profiles
- 11.2.1 Infineon
- 11.2.1.1. Overview
- 11.2.1.2. Products
- 11.2.1.3. SWOT Analysis
- 11.2.1.4. Recent Developments
- 11.2.1.5. Financials (Based on Availability)
- 11.2.2 Texas Instruments
- 11.2.2.1. Overview
- 11.2.2.2. Products
- 11.2.2.3. SWOT Analysis
- 11.2.2.4. Recent Developments
- 11.2.2.5. Financials (Based on Availability)
- 11.2.3 ON Semiconductor
- 11.2.3.1. Overview
- 11.2.3.2. Products
- 11.2.3.3. SWOT Analysis
- 11.2.3.4. Recent Developments
- 11.2.3.5. Financials (Based on Availability)
- 11.2.4 STMicroelectronics
- 11.2.4.1. Overview
- 11.2.4.2. Products
- 11.2.4.3. SWOT Analysis
- 11.2.4.4. Recent Developments
- 11.2.4.5. Financials (Based on Availability)
- 11.2.5 Mitsubishi Electric Corporation
- 11.2.5.1. Overview
- 11.2.5.2. Products
- 11.2.5.3. SWOT Analysis
- 11.2.5.4. Recent Developments
- 11.2.5.5. Financials (Based on Availability)
- 11.2.6 Toshiba
- 11.2.6.1. Overview
- 11.2.6.2. Products
- 11.2.6.3. SWOT Analysis
- 11.2.6.4. Recent Developments
- 11.2.6.5. Financials (Based on Availability)
- 11.2.7 Vishay Intertechnology
- 11.2.7.1. Overview
- 11.2.7.2. Products
- 11.2.7.3. SWOT Analysis
- 11.2.7.4. Recent Developments
- 11.2.7.5. Financials (Based on Availability)
- 11.2.8 Fuji Electric
- 11.2.8.1. Overview
- 11.2.8.2. Products
- 11.2.8.3. SWOT Analysis
- 11.2.8.4. Recent Developments
- 11.2.8.5. Financials (Based on Availability)
- 11.2.9 Nexperia
- 11.2.9.1. Overview
- 11.2.9.2. Products
- 11.2.9.3. SWOT Analysis
- 11.2.9.4. Recent Developments
- 11.2.9.5. Financials (Based on Availability)
- 11.2.10 Littelfuse
- 11.2.10.1. Overview
- 11.2.10.2. Products
- 11.2.10.3. SWOT Analysis
- 11.2.10.4. Recent Developments
- 11.2.10.5. Financials (Based on Availability)
- 11.2.11 Renesas Electronics
- 11.2.11.1. Overview
- 11.2.11.2. Products
- 11.2.11.3. SWOT Analysis
- 11.2.11.4. Recent Developments
- 11.2.11.5. Financials (Based on Availability)
- 11.2.12 Semekron
- 11.2.12.1. Overview
- 11.2.12.2. Products
- 11.2.12.3. SWOT Analysis
- 11.2.12.4. Recent Developments
- 11.2.12.5. Financials (Based on Availability)
- 11.2.1 Infineon
List of Figures
- Figure 1: Global Power Semiconductor Revenue Breakdown (million, %) by Region 2025 & 2033
- Figure 2: North America Power Semiconductor Revenue (million), by Application 2025 & 2033
- Figure 3: North America Power Semiconductor Revenue Share (%), by Application 2025 & 2033
- Figure 4: North America Power Semiconductor Revenue (million), by Types 2025 & 2033
- Figure 5: North America Power Semiconductor Revenue Share (%), by Types 2025 & 2033
- Figure 6: North America Power Semiconductor Revenue (million), by Country 2025 & 2033
- Figure 7: North America Power Semiconductor Revenue Share (%), by Country 2025 & 2033
- Figure 8: South America Power Semiconductor Revenue (million), by Application 2025 & 2033
- Figure 9: South America Power Semiconductor Revenue Share (%), by Application 2025 & 2033
- Figure 10: South America Power Semiconductor Revenue (million), by Types 2025 & 2033
- Figure 11: South America Power Semiconductor Revenue Share (%), by Types 2025 & 2033
- Figure 12: South America Power Semiconductor Revenue (million), by Country 2025 & 2033
- Figure 13: South America Power Semiconductor Revenue Share (%), by Country 2025 & 2033
- Figure 14: Europe Power Semiconductor Revenue (million), by Application 2025 & 2033
- Figure 15: Europe Power Semiconductor Revenue Share (%), by Application 2025 & 2033
- Figure 16: Europe Power Semiconductor Revenue (million), by Types 2025 & 2033
- Figure 17: Europe Power Semiconductor Revenue Share (%), by Types 2025 & 2033
- Figure 18: Europe Power Semiconductor Revenue (million), by Country 2025 & 2033
- Figure 19: Europe Power Semiconductor Revenue Share (%), by Country 2025 & 2033
- Figure 20: Middle East & Africa Power Semiconductor Revenue (million), by Application 2025 & 2033
- Figure 21: Middle East & Africa Power Semiconductor Revenue Share (%), by Application 2025 & 2033
- Figure 22: Middle East & Africa Power Semiconductor Revenue (million), by Types 2025 & 2033
- Figure 23: Middle East & Africa Power Semiconductor Revenue Share (%), by Types 2025 & 2033
- Figure 24: Middle East & Africa Power Semiconductor Revenue (million), by Country 2025 & 2033
- Figure 25: Middle East & Africa Power Semiconductor Revenue Share (%), by Country 2025 & 2033
- Figure 26: Asia Pacific Power Semiconductor Revenue (million), by Application 2025 & 2033
- Figure 27: Asia Pacific Power Semiconductor Revenue Share (%), by Application 2025 & 2033
- Figure 28: Asia Pacific Power Semiconductor Revenue (million), by Types 2025 & 2033
- Figure 29: Asia Pacific Power Semiconductor Revenue Share (%), by Types 2025 & 2033
- Figure 30: Asia Pacific Power Semiconductor Revenue (million), by Country 2025 & 2033
- Figure 31: Asia Pacific Power Semiconductor Revenue Share (%), by Country 2025 & 2033
List of Tables
- Table 1: Global Power Semiconductor Revenue million Forecast, by Application 2020 & 2033
- Table 2: Global Power Semiconductor Revenue million Forecast, by Types 2020 & 2033
- Table 3: Global Power Semiconductor Revenue million Forecast, by Region 2020 & 2033
- Table 4: Global Power Semiconductor Revenue million Forecast, by Application 2020 & 2033
- Table 5: Global Power Semiconductor Revenue million Forecast, by Types 2020 & 2033
- Table 6: Global Power Semiconductor Revenue million Forecast, by Country 2020 & 2033
- Table 7: United States Power Semiconductor Revenue (million) Forecast, by Application 2020 & 2033
- Table 8: Canada Power Semiconductor Revenue (million) Forecast, by Application 2020 & 2033
- Table 9: Mexico Power Semiconductor Revenue (million) Forecast, by Application 2020 & 2033
- Table 10: Global Power Semiconductor Revenue million Forecast, by Application 2020 & 2033
- Table 11: Global Power Semiconductor Revenue million Forecast, by Types 2020 & 2033
- Table 12: Global Power Semiconductor Revenue million Forecast, by Country 2020 & 2033
- Table 13: Brazil Power Semiconductor Revenue (million) Forecast, by Application 2020 & 2033
- Table 14: Argentina Power Semiconductor Revenue (million) Forecast, by Application 2020 & 2033
- Table 15: Rest of South America Power Semiconductor Revenue (million) Forecast, by Application 2020 & 2033
- Table 16: Global Power Semiconductor Revenue million Forecast, by Application 2020 & 2033
- Table 17: Global Power Semiconductor Revenue million Forecast, by Types 2020 & 2033
- Table 18: Global Power Semiconductor Revenue million Forecast, by Country 2020 & 2033
- Table 19: United Kingdom Power Semiconductor Revenue (million) Forecast, by Application 2020 & 2033
- Table 20: Germany Power Semiconductor Revenue (million) Forecast, by Application 2020 & 2033
- Table 21: France Power Semiconductor Revenue (million) Forecast, by Application 2020 & 2033
- Table 22: Italy Power Semiconductor Revenue (million) Forecast, by Application 2020 & 2033
- Table 23: Spain Power Semiconductor Revenue (million) Forecast, by Application 2020 & 2033
- Table 24: Russia Power Semiconductor Revenue (million) Forecast, by Application 2020 & 2033
- Table 25: Benelux Power Semiconductor Revenue (million) Forecast, by Application 2020 & 2033
- Table 26: Nordics Power Semiconductor Revenue (million) Forecast, by Application 2020 & 2033
- Table 27: Rest of Europe Power Semiconductor Revenue (million) Forecast, by Application 2020 & 2033
- Table 28: Global Power Semiconductor Revenue million Forecast, by Application 2020 & 2033
- Table 29: Global Power Semiconductor Revenue million Forecast, by Types 2020 & 2033
- Table 30: Global Power Semiconductor Revenue million Forecast, by Country 2020 & 2033
- Table 31: Turkey Power Semiconductor Revenue (million) Forecast, by Application 2020 & 2033
- Table 32: Israel Power Semiconductor Revenue (million) Forecast, by Application 2020 & 2033
- Table 33: GCC Power Semiconductor Revenue (million) Forecast, by Application 2020 & 2033
- Table 34: North Africa Power Semiconductor Revenue (million) Forecast, by Application 2020 & 2033
- Table 35: South Africa Power Semiconductor Revenue (million) Forecast, by Application 2020 & 2033
- Table 36: Rest of Middle East & Africa Power Semiconductor Revenue (million) Forecast, by Application 2020 & 2033
- Table 37: Global Power Semiconductor Revenue million Forecast, by Application 2020 & 2033
- Table 38: Global Power Semiconductor Revenue million Forecast, by Types 2020 & 2033
- Table 39: Global Power Semiconductor Revenue million Forecast, by Country 2020 & 2033
- Table 40: China Power Semiconductor Revenue (million) Forecast, by Application 2020 & 2033
- Table 41: India Power Semiconductor Revenue (million) Forecast, by Application 2020 & 2033
- Table 42: Japan Power Semiconductor Revenue (million) Forecast, by Application 2020 & 2033
- Table 43: South Korea Power Semiconductor Revenue (million) Forecast, by Application 2020 & 2033
- Table 44: ASEAN Power Semiconductor Revenue (million) Forecast, by Application 2020 & 2033
- Table 45: Oceania Power Semiconductor Revenue (million) Forecast, by Application 2020 & 2033
- Table 46: Rest of Asia Pacific Power Semiconductor Revenue (million) Forecast, by Application 2020 & 2033
Frequently Asked Questions
1. What is the projected Compound Annual Growth Rate (CAGR) of the Power Semiconductor?
The projected CAGR is approximately XX%.
2. Which companies are prominent players in the Power Semiconductor?
Key companies in the market include Infineon, Texas Instruments, ON Semiconductor, STMicroelectronics, Mitsubishi Electric Corporation, Toshiba, Vishay Intertechnology, Fuji Electric, Nexperia, Littelfuse, Renesas Electronics, Semekron.
3. What are the main segments of the Power Semiconductor?
The market segments include Application, Types.
4. Can you provide details about the market size?
The market size is estimated to be USD XXX million as of 2022.
5. What are some drivers contributing to market growth?
N/A
6. What are the notable trends driving market growth?
N/A
7. Are there any restraints impacting market growth?
N/A
8. Can you provide examples of recent developments in the market?
N/A
9. What pricing options are available for accessing the report?
Pricing options include single-user, multi-user, and enterprise licenses priced at USD 2900.00, USD 4350.00, and USD 5800.00 respectively.
10. Is the market size provided in terms of value or volume?
The market size is provided in terms of value, measured in million.
11. Are there any specific market keywords associated with the report?
Yes, the market keyword associated with the report is "Power Semiconductor," which aids in identifying and referencing the specific market segment covered.
12. How do I determine which pricing option suits my needs best?
The pricing options vary based on user requirements and access needs. Individual users may opt for single-user licenses, while businesses requiring broader access may choose multi-user or enterprise licenses for cost-effective access to the report.
13. Are there any additional resources or data provided in the Power Semiconductor report?
While the report offers comprehensive insights, it's advisable to review the specific contents or supplementary materials provided to ascertain if additional resources or data are available.
14. How can I stay updated on further developments or reports in the Power Semiconductor?
To stay informed about further developments, trends, and reports in the Power Semiconductor, consider subscribing to industry newsletters, following relevant companies and organizations, or regularly checking reputable industry news sources and publications.
Methodology
Step 1 - Identification of Relevant Samples Size from Population Database


Step 2 - Approaches for Defining Global Market Size (Value, Volume* & Price*)

Note*: In applicable scenarios
Step 3 - Data Sources
Primary Research
- Web Analytics
- Survey Reports
- Research Institute
- Latest Research Reports
- Opinion Leaders
Secondary Research
- Annual Reports
- White Paper
- Latest Press Release
- Industry Association
- Paid Database
- Investor Presentations

Step 4 - Data Triangulation
Involves using different sources of information in order to increase the validity of a study
These sources are likely to be stakeholders in a program - participants, other researchers, program staff, other community members, and so on.
Then we put all data in single framework & apply various statistical tools to find out the dynamic on the market.
During the analysis stage, feedback from the stakeholder groups would be compared to determine areas of agreement as well as areas of divergence