

Key Insights
The US Ready-to-Drink (RTD) tea market is projected to reach $9.3 billion by 2025, with a Compound Annual Growth Rate (CAGR) of 2.6%. This growth is propelled by increasing consumer demand for healthier beverage alternatives, the convenience and portability of RTD formats, and a wide array of evolving flavor profiles, including green, herbal, and iced teas. Innovative packaging solutions, such as aseptic and PET bottles, further enhance product appeal and shelf life. Key market players, including PepsiCo, Coca-Cola, and Nestle, are actively driving expansion through product diversification and targeted marketing. While the market is largely consolidated, emerging brands are introducing niche offerings in segments like organic and functional teas. Broad accessibility is ensured through both off-trade retail and on-trade establishments.
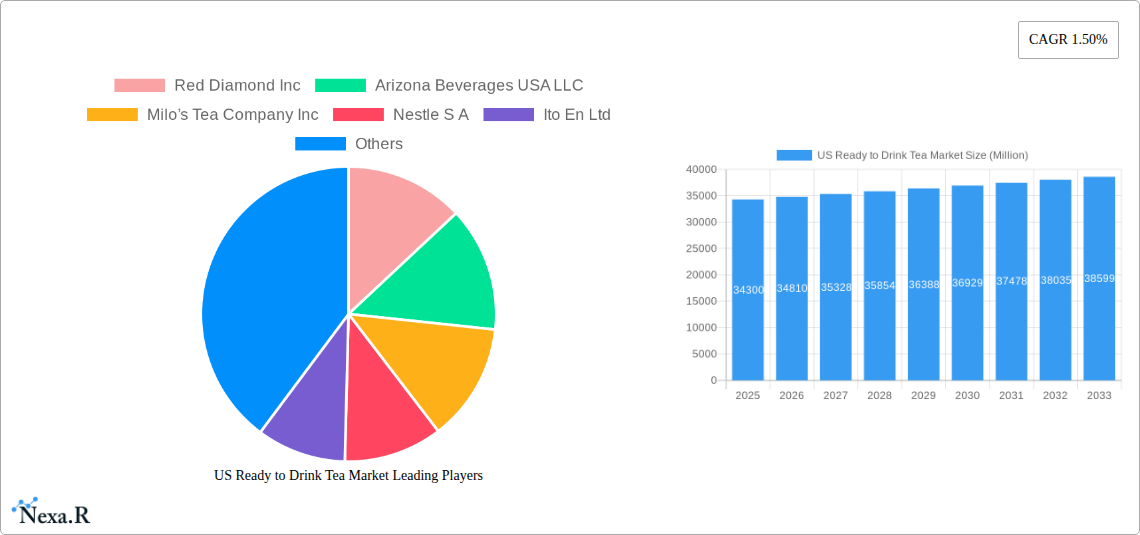
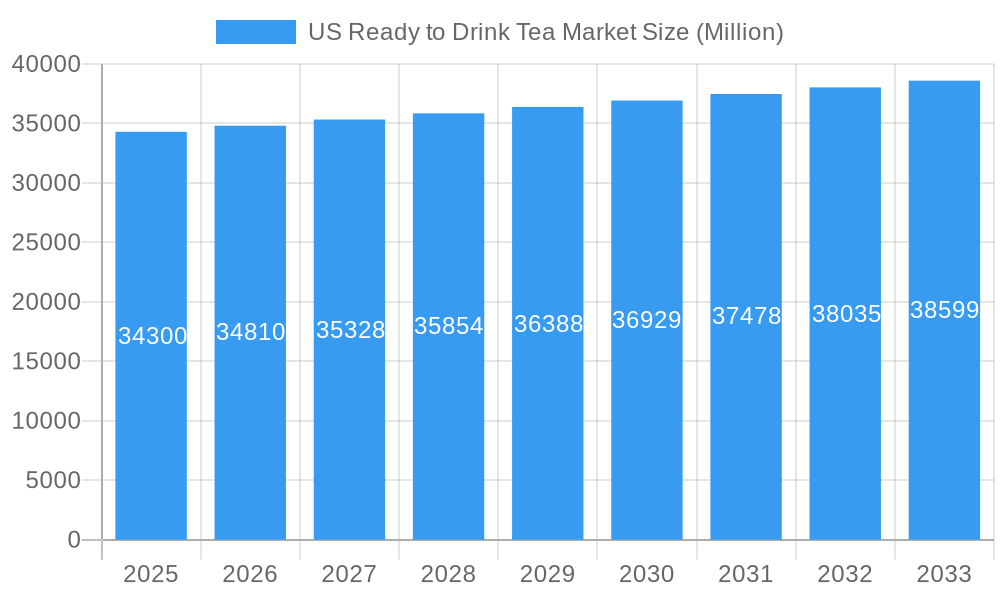
US Ready to Drink Tea Market Market Size (In Billion)
Regional growth variations are anticipated within the US, with the Northeast and West potentially leading due to higher disposable incomes and health-conscious demographics, though the Midwest and South remain substantial contributors. Future market expansion will be shaped by consumer health awareness, evolving taste preferences, and novel product introductions. The sustained growth of the US RTD tea market underscores a significant consumer shift towards healthier, convenient beverage choices, mirroring global trends. Continued innovation in flavor, health benefits, and sustainable packaging will be crucial for maintaining long-term market expansion and adapting to evolving consumer needs.
US Ready to Drink Tea Market Company Market Share
US Ready to Drink Tea Market: A Comprehensive Report (2019-2033)
This in-depth report provides a comprehensive analysis of the US Ready to Drink (RTD) Tea market, encompassing market dynamics, growth trends, competitive landscape, and future outlook. The study period covers 2019-2033, with a base year of 2025 and a forecast period of 2025-2033. This report is an invaluable resource for industry professionals, investors, and strategic decision-makers seeking to understand and capitalize on opportunities within this dynamic market. The market is segmented by soft drink type (Green Tea, Herbal Tea, Iced Tea, Other RTD Tea), packaging type (Aseptic packages, Glass Bottles, Metal Can, PET Bottles), and distribution channel (Off-trade, On-trade). Key players analyzed include Red Diamond Inc, Arizona Beverages USA LLC, Milo’s Tea Company Inc, Nestle S.A., Ito En Ltd, PepsiCo Inc, Hawaiian Sun Products Inc, Keurig Dr Pepper Inc, The Coca-Cola Company, Del Monte Foods Inc, Reily Foods Company, and Walmart Inc. The market size is presented in Million units.
US Ready to Drink Tea Market Market Dynamics & Structure
The US RTD tea market is characterized by a moderately consolidated structure with key players holding significant market share. The market's growth is fueled by technological innovations in packaging and beverage formulations, catering to evolving consumer preferences for healthier and more convenient beverage options. Stringent regulatory frameworks governing food and beverage safety impact market operations. Competition from other ready-to-drink beverages, like soft drinks and juices, presents a challenge. The market also exhibits strong end-user demographic segmentation, with varying preferences across age groups and lifestyles. M&A activity is relatively frequent, particularly among smaller players seeking to gain market share and scale.
- Market Concentration: The top 5 players account for approximately xx% of the market share in 2025.
- Technological Innovation: Focus on sustainable packaging (e.g., recyclable PET bottles) and functional beverages (e.g., enhanced with vitamins or antioxidants) are key drivers.
- Regulatory Framework: FDA regulations on labeling, ingredients, and safety standards significantly influence market operations.
- Competitive Substitutes: Soft drinks, juices, and bottled water are major competitors.
- End-User Demographics: Millennials and Gen Z represent significant consumer segments, driving demand for innovative flavors and functional benefits.
- M&A Trends: xx M&A deals were recorded in the historical period (2019-2024), with an expected xx in the forecast period.
US Ready to Drink Tea Market Growth Trends & Insights
The US RTD tea market experienced a CAGR of xx% during the historical period (2019-2024) and is projected to grow at a CAGR of xx% during the forecast period (2025-2033), reaching xx million units by 2033. This growth is attributed to increasing consumer demand for healthier beverage options, the rising popularity of tea as a functional beverage, and the ongoing development of innovative product formulations and packaging. Technological advancements, such as improved brewing techniques and enhanced packaging materials, have contributed to improved product quality and shelf life, further fueling market expansion. Shifts in consumer behavior, including a preference for convenient, on-the-go consumption, have also driven the adoption of RTD tea. Market penetration for RTD tea is expected to increase from xx% in 2025 to xx% by 2033.
Dominant Regions, Countries, or Segments in US Ready to Drink Tea Market
The Iced Tea segment dominates the US RTD tea market, accounting for xx% of the market share in 2025, driven by its widespread popularity and established consumer base. The PET Bottles packaging segment also holds a significant market share (xx%), reflecting its affordability, convenience, and recyclability. The Off-trade distribution channel remains dominant (xx%), reflecting the high penetration of RTD tea in supermarkets, convenience stores, and other retail outlets. Growth is expected to be strongest in the South region, which has a strong tea-drinking culture and high consumption rates.
- Key Drivers (Iced Tea Segment): Strong consumer preference for refreshing and widely available options.
- Key Drivers (PET Bottles Segment): Cost-effectiveness, consumer convenience, and environmental considerations.
- Key Drivers (Off-trade Channel): Established distribution networks and widespread retail availability.
- Key Drivers (South Region): Strong established tea-drinking culture and high consumption rates.
US Ready to Drink Tea Market Product Landscape
The US RTD tea market showcases a diverse range of products, from traditional iced tea varieties to innovative functional beverages with added vitamins, antioxidants, or herbal infusions. Product innovation is focused on enhancing flavor profiles, introducing new and exciting tea blends, and incorporating natural and organic ingredients to appeal to health-conscious consumers. Companies are also exploring sustainable packaging options and convenient formats to meet changing consumer preferences. Key performance metrics include shelf life, taste, and overall consumer satisfaction. Unique selling propositions frequently focus on organic certification, unique flavor combinations, functional ingredients (e.g., added probiotics), and convenient packaging sizes.
Key Drivers, Barriers & Challenges in US Ready to Drink Tea Market
Key Drivers: Growing health consciousness, increasing demand for convenient beverages, and technological advancements in brewing and packaging are major market drivers. The rising popularity of functional beverages is also a significant factor, with consumers seeking added health benefits beyond simple refreshment.
Key Barriers & Challenges: Intense competition from other beverage categories, fluctuations in raw material costs (e.g., tea leaves), and evolving consumer preferences can significantly impact market growth. Supply chain disruptions, particularly related to sourcing tea leaves and packaging materials, also pose challenges. Regulatory hurdles concerning labeling and ingredient standards can add to the complexity of market operations. Estimated losses due to supply chain disruptions in 2022 were approximately xx million units.
Emerging Opportunities in US Ready to Drink Tea Market
The market presents exciting opportunities in the areas of functional teas (e.g., teas infused with adaptogens or probiotics), organic and sustainably sourced products, innovative packaging formats (e.g., ready-to-drink tea pouches), and expansion into niche markets (e.g., premium and specialty teas). Untapped market segments include exploring new flavor profiles to cater to diverse tastes and offering premium RTD tea options to a more discerning consumer base.
Growth Accelerators in the US Ready to Drink Tea Market Industry
Technological breakthroughs in beverage processing and packaging, strategic partnerships to expand distribution networks and enhance brand visibility, and successful marketing strategies to capture new consumer segments are key growth accelerators. Expanding into international markets, leveraging e-commerce channels, and focusing on sustainable practices will further bolster market growth.
Key Players Shaping the US Ready to Drink Tea Market Market
- Red Diamond Inc
- Arizona Beverages USA LLC
- Milo’s Tea Company Inc
- Nestle S.A.
- Ito En Ltd
- PepsiCo Inc
- Hawaiian Sun Products Inc
- Keurig Dr Pepper Inc
- The Coca-Cola Company
- Del Monte Foods Inc
- Reily Foods Company
- Walmart Inc
Notable Milestones in US Ready to Drink Tea Market Sector
- January 2023: Milo's Tea Company announces a USD 130 million investment in a new plant and distribution center, reflecting significant brand growth.
- January 2023: Lipton Tea partners with Full Cart to improve access to healthy nutrition, showcasing corporate social responsibility.
- December 2022: Pure Leaf launches a limited-edition Merry Mint Iced Tea, leveraging a successful movie tie-in and social media campaign.
In-Depth US Ready to Drink Tea Market Market Outlook
The US RTD tea market is poised for continued growth driven by innovation, evolving consumer preferences, and the expansion of distribution channels. Strategic partnerships, investments in sustainable packaging, and the development of functional beverages will further propel market expansion. The market presents significant opportunities for both established players and emerging brands to capitalize on the growing demand for healthier, convenient, and exciting tea-based beverages.
US Ready to Drink Tea Market Segmentation
-
1. Soft Drink Type
- 1.1. Green Tea
- 1.2. Herbal Tea
- 1.3. Iced Tea
- 1.4. Other RTD Tea
-
2. Packaging Type
- 2.1. Aseptic packages
- 2.2. Glass Bottles
- 2.3. Metal Can
- 2.4. PET Bottles
-
3. Distribution Channel
-
3.1. Off-trade
- 3.1.1. Convenience Stores
- 3.1.2. Online Retail
- 3.1.3. Supermarket/Hypermarket
- 3.1.4. Others
- 3.2. On-trade
-
3.1. Off-trade
US Ready to Drink Tea Market Segmentation By Geography
-
1. North America
- 1.1. United States
- 1.2. Canada
- 1.3. Mexico
-
2. South America
- 2.1. Brazil
- 2.2. Argentina
- 2.3. Rest of South America
-
3. Europe
- 3.1. United Kingdom
- 3.2. Germany
- 3.3. France
- 3.4. Italy
- 3.5. Spain
- 3.6. Russia
- 3.7. Benelux
- 3.8. Nordics
- 3.9. Rest of Europe
-
4. Middle East & Africa
- 4.1. Turkey
- 4.2. Israel
- 4.3. GCC
- 4.4. North Africa
- 4.5. South Africa
- 4.6. Rest of Middle East & Africa
-
5. Asia Pacific
- 5.1. China
- 5.2. India
- 5.3. Japan
- 5.4. South Korea
- 5.5. ASEAN
- 5.6. Oceania
- 5.7. Rest of Asia Pacific
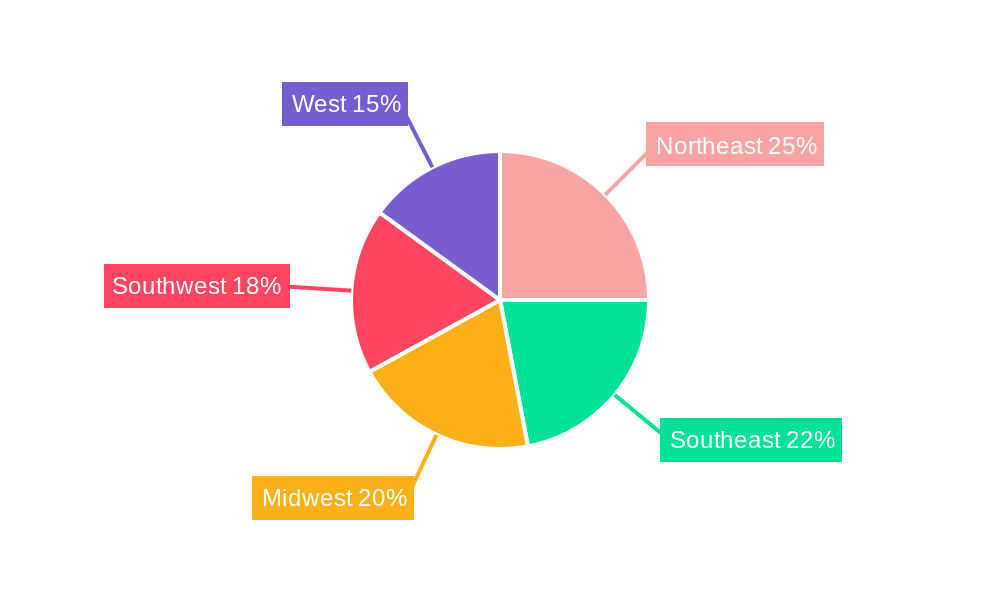
US Ready to Drink Tea Market Regional Market Share
Geographic Coverage of US Ready to Drink Tea Market
US Ready to Drink Tea Market REPORT HIGHLIGHTS
| Aspects | Details |
|---|---|
| Study Period | 2020-2034 |
| Base Year | 2025 |
| Estimated Year | 2026 |
| Forecast Period | 2026-2034 |
| Historical Period | 2020-2025 |
| Growth Rate | CAGR of 2.6% from 2020-2034 |
| Segmentation |
|
Table of Contents
- 1. Introduction
- 1.1. Research Scope
- 1.2. Market Segmentation
- 1.3. Research Methodology
- 1.4. Definitions and Assumptions
- 2. Executive Summary
- 2.1. Introduction
- 3. Market Dynamics
- 3.1. Introduction
- 3.2. Market Drivers
- 3.2.1. Increasing demand for meat alternatives
- 3.3. Market Restrains
- 3.3.1. Presence of numerous alternatives in the plant proteins
- 3.4. Market Trends
- 3.4.1. OTHER KEY INDUSTRY TRENDS COVERED IN THE REPORT
- 4. Market Factor Analysis
- 4.1. Porters Five Forces
- 4.2. Supply/Value Chain
- 4.3. PESTEL analysis
- 4.4. Market Entropy
- 4.5. Patent/Trademark Analysis
- 5. Global US Ready to Drink Tea Market Analysis, Insights and Forecast, 2020-2032
- 5.1. Market Analysis, Insights and Forecast - by Soft Drink Type
- 5.1.1. Green Tea
- 5.1.2. Herbal Tea
- 5.1.3. Iced Tea
- 5.1.4. Other RTD Tea
- 5.2. Market Analysis, Insights and Forecast - by Packaging Type
- 5.2.1. Aseptic packages
- 5.2.2. Glass Bottles
- 5.2.3. Metal Can
- 5.2.4. PET Bottles
- 5.3. Market Analysis, Insights and Forecast - by Distribution Channel
- 5.3.1. Off-trade
- 5.3.1.1. Convenience Stores
- 5.3.1.2. Online Retail
- 5.3.1.3. Supermarket/Hypermarket
- 5.3.1.4. Others
- 5.3.2. On-trade
- 5.3.1. Off-trade
- 5.4. Market Analysis, Insights and Forecast - by Region
- 5.4.1. North America
- 5.4.2. South America
- 5.4.3. Europe
- 5.4.4. Middle East & Africa
- 5.4.5. Asia Pacific
- 5.1. Market Analysis, Insights and Forecast - by Soft Drink Type
- 6. North America US Ready to Drink Tea Market Analysis, Insights and Forecast, 2020-2032
- 6.1. Market Analysis, Insights and Forecast - by Soft Drink Type
- 6.1.1. Green Tea
- 6.1.2. Herbal Tea
- 6.1.3. Iced Tea
- 6.1.4. Other RTD Tea
- 6.2. Market Analysis, Insights and Forecast - by Packaging Type
- 6.2.1. Aseptic packages
- 6.2.2. Glass Bottles
- 6.2.3. Metal Can
- 6.2.4. PET Bottles
- 6.3. Market Analysis, Insights and Forecast - by Distribution Channel
- 6.3.1. Off-trade
- 6.3.1.1. Convenience Stores
- 6.3.1.2. Online Retail
- 6.3.1.3. Supermarket/Hypermarket
- 6.3.1.4. Others
- 6.3.2. On-trade
- 6.3.1. Off-trade
- 6.1. Market Analysis, Insights and Forecast - by Soft Drink Type
- 7. South America US Ready to Drink Tea Market Analysis, Insights and Forecast, 2020-2032
- 7.1. Market Analysis, Insights and Forecast - by Soft Drink Type
- 7.1.1. Green Tea
- 7.1.2. Herbal Tea
- 7.1.3. Iced Tea
- 7.1.4. Other RTD Tea
- 7.2. Market Analysis, Insights and Forecast - by Packaging Type
- 7.2.1. Aseptic packages
- 7.2.2. Glass Bottles
- 7.2.3. Metal Can
- 7.2.4. PET Bottles
- 7.3. Market Analysis, Insights and Forecast - by Distribution Channel
- 7.3.1. Off-trade
- 7.3.1.1. Convenience Stores
- 7.3.1.2. Online Retail
- 7.3.1.3. Supermarket/Hypermarket
- 7.3.1.4. Others
- 7.3.2. On-trade
- 7.3.1. Off-trade
- 7.1. Market Analysis, Insights and Forecast - by Soft Drink Type
- 8. Europe US Ready to Drink Tea Market Analysis, Insights and Forecast, 2020-2032
- 8.1. Market Analysis, Insights and Forecast - by Soft Drink Type
- 8.1.1. Green Tea
- 8.1.2. Herbal Tea
- 8.1.3. Iced Tea
- 8.1.4. Other RTD Tea
- 8.2. Market Analysis, Insights and Forecast - by Packaging Type
- 8.2.1. Aseptic packages
- 8.2.2. Glass Bottles
- 8.2.3. Metal Can
- 8.2.4. PET Bottles
- 8.3. Market Analysis, Insights and Forecast - by Distribution Channel
- 8.3.1. Off-trade
- 8.3.1.1. Convenience Stores
- 8.3.1.2. Online Retail
- 8.3.1.3. Supermarket/Hypermarket
- 8.3.1.4. Others
- 8.3.2. On-trade
- 8.3.1. Off-trade
- 8.1. Market Analysis, Insights and Forecast - by Soft Drink Type
- 9. Middle East & Africa US Ready to Drink Tea Market Analysis, Insights and Forecast, 2020-2032
- 9.1. Market Analysis, Insights and Forecast - by Soft Drink Type
- 9.1.1. Green Tea
- 9.1.2. Herbal Tea
- 9.1.3. Iced Tea
- 9.1.4. Other RTD Tea
- 9.2. Market Analysis, Insights and Forecast - by Packaging Type
- 9.2.1. Aseptic packages
- 9.2.2. Glass Bottles
- 9.2.3. Metal Can
- 9.2.4. PET Bottles
- 9.3. Market Analysis, Insights and Forecast - by Distribution Channel
- 9.3.1. Off-trade
- 9.3.1.1. Convenience Stores
- 9.3.1.2. Online Retail
- 9.3.1.3. Supermarket/Hypermarket
- 9.3.1.4. Others
- 9.3.2. On-trade
- 9.3.1. Off-trade
- 9.1. Market Analysis, Insights and Forecast - by Soft Drink Type
- 10. Asia Pacific US Ready to Drink Tea Market Analysis, Insights and Forecast, 2020-2032
- 10.1. Market Analysis, Insights and Forecast - by Soft Drink Type
- 10.1.1. Green Tea
- 10.1.2. Herbal Tea
- 10.1.3. Iced Tea
- 10.1.4. Other RTD Tea
- 10.2. Market Analysis, Insights and Forecast - by Packaging Type
- 10.2.1. Aseptic packages
- 10.2.2. Glass Bottles
- 10.2.3. Metal Can
- 10.2.4. PET Bottles
- 10.3. Market Analysis, Insights and Forecast - by Distribution Channel
- 10.3.1. Off-trade
- 10.3.1.1. Convenience Stores
- 10.3.1.2. Online Retail
- 10.3.1.3. Supermarket/Hypermarket
- 10.3.1.4. Others
- 10.3.2. On-trade
- 10.3.1. Off-trade
- 10.1. Market Analysis, Insights and Forecast - by Soft Drink Type
- 11. Competitive Analysis
- 11.1. Global Market Share Analysis 2025
- 11.2. Company Profiles
- 11.2.1 Red Diamond Inc
- 11.2.1.1. Overview
- 11.2.1.2. Products
- 11.2.1.3. SWOT Analysis
- 11.2.1.4. Recent Developments
- 11.2.1.5. Financials (Based on Availability)
- 11.2.2 Arizona Beverages USA LLC
- 11.2.2.1. Overview
- 11.2.2.2. Products
- 11.2.2.3. SWOT Analysis
- 11.2.2.4. Recent Developments
- 11.2.2.5. Financials (Based on Availability)
- 11.2.3 Milo’s Tea Company Inc
- 11.2.3.1. Overview
- 11.2.3.2. Products
- 11.2.3.3. SWOT Analysis
- 11.2.3.4. Recent Developments
- 11.2.3.5. Financials (Based on Availability)
- 11.2.4 Nestle S A
- 11.2.4.1. Overview
- 11.2.4.2. Products
- 11.2.4.3. SWOT Analysis
- 11.2.4.4. Recent Developments
- 11.2.4.5. Financials (Based on Availability)
- 11.2.5 Ito En Ltd
- 11.2.5.1. Overview
- 11.2.5.2. Products
- 11.2.5.3. SWOT Analysis
- 11.2.5.4. Recent Developments
- 11.2.5.5. Financials (Based on Availability)
- 11.2.6 PepsiCo Inc
- 11.2.6.1. Overview
- 11.2.6.2. Products
- 11.2.6.3. SWOT Analysis
- 11.2.6.4. Recent Developments
- 11.2.6.5. Financials (Based on Availability)
- 11.2.7 Hawaiian Sun Products Inc
- 11.2.7.1. Overview
- 11.2.7.2. Products
- 11.2.7.3. SWOT Analysis
- 11.2.7.4. Recent Developments
- 11.2.7.5. Financials (Based on Availability)
- 11.2.8 Keurig Dr Pepper Inc
- 11.2.8.1. Overview
- 11.2.8.2. Products
- 11.2.8.3. SWOT Analysis
- 11.2.8.4. Recent Developments
- 11.2.8.5. Financials (Based on Availability)
- 11.2.9 The Coca-Cola Company
- 11.2.9.1. Overview
- 11.2.9.2. Products
- 11.2.9.3. SWOT Analysis
- 11.2.9.4. Recent Developments
- 11.2.9.5. Financials (Based on Availability)
- 11.2.10 Del Monte Foods Inc
- 11.2.10.1. Overview
- 11.2.10.2. Products
- 11.2.10.3. SWOT Analysis
- 11.2.10.4. Recent Developments
- 11.2.10.5. Financials (Based on Availability)
- 11.2.11 Reily Foods Company
- 11.2.11.1. Overview
- 11.2.11.2. Products
- 11.2.11.3. SWOT Analysis
- 11.2.11.4. Recent Developments
- 11.2.11.5. Financials (Based on Availability)
- 11.2.12 Walmart Inc
- 11.2.12.1. Overview
- 11.2.12.2. Products
- 11.2.12.3. SWOT Analysis
- 11.2.12.4. Recent Developments
- 11.2.12.5. Financials (Based on Availability)
- 11.2.1 Red Diamond Inc
List of Figures
- Figure 1: Global US Ready to Drink Tea Market Revenue Breakdown (billion, %) by Region 2025 & 2033
- Figure 2: Global US Ready to Drink Tea Market Volume Breakdown (K Tons, %) by Region 2025 & 2033
- Figure 3: North America US Ready to Drink Tea Market Revenue (billion), by Soft Drink Type 2025 & 2033
- Figure 4: North America US Ready to Drink Tea Market Volume (K Tons), by Soft Drink Type 2025 & 2033
- Figure 5: North America US Ready to Drink Tea Market Revenue Share (%), by Soft Drink Type 2025 & 2033
- Figure 6: North America US Ready to Drink Tea Market Volume Share (%), by Soft Drink Type 2025 & 2033
- Figure 7: North America US Ready to Drink Tea Market Revenue (billion), by Packaging Type 2025 & 2033
- Figure 8: North America US Ready to Drink Tea Market Volume (K Tons), by Packaging Type 2025 & 2033
- Figure 9: North America US Ready to Drink Tea Market Revenue Share (%), by Packaging Type 2025 & 2033
- Figure 10: North America US Ready to Drink Tea Market Volume Share (%), by Packaging Type 2025 & 2033
- Figure 11: North America US Ready to Drink Tea Market Revenue (billion), by Distribution Channel 2025 & 2033
- Figure 12: North America US Ready to Drink Tea Market Volume (K Tons), by Distribution Channel 2025 & 2033
- Figure 13: North America US Ready to Drink Tea Market Revenue Share (%), by Distribution Channel 2025 & 2033
- Figure 14: North America US Ready to Drink Tea Market Volume Share (%), by Distribution Channel 2025 & 2033
- Figure 15: North America US Ready to Drink Tea Market Revenue (billion), by Country 2025 & 2033
- Figure 16: North America US Ready to Drink Tea Market Volume (K Tons), by Country 2025 & 2033
- Figure 17: North America US Ready to Drink Tea Market Revenue Share (%), by Country 2025 & 2033
- Figure 18: North America US Ready to Drink Tea Market Volume Share (%), by Country 2025 & 2033
- Figure 19: South America US Ready to Drink Tea Market Revenue (billion), by Soft Drink Type 2025 & 2033
- Figure 20: South America US Ready to Drink Tea Market Volume (K Tons), by Soft Drink Type 2025 & 2033
- Figure 21: South America US Ready to Drink Tea Market Revenue Share (%), by Soft Drink Type 2025 & 2033
- Figure 22: South America US Ready to Drink Tea Market Volume Share (%), by Soft Drink Type 2025 & 2033
- Figure 23: South America US Ready to Drink Tea Market Revenue (billion), by Packaging Type 2025 & 2033
- Figure 24: South America US Ready to Drink Tea Market Volume (K Tons), by Packaging Type 2025 & 2033
- Figure 25: South America US Ready to Drink Tea Market Revenue Share (%), by Packaging Type 2025 & 2033
- Figure 26: South America US Ready to Drink Tea Market Volume Share (%), by Packaging Type 2025 & 2033
- Figure 27: South America US Ready to Drink Tea Market Revenue (billion), by Distribution Channel 2025 & 2033
- Figure 28: South America US Ready to Drink Tea Market Volume (K Tons), by Distribution Channel 2025 & 2033
- Figure 29: South America US Ready to Drink Tea Market Revenue Share (%), by Distribution Channel 2025 & 2033
- Figure 30: South America US Ready to Drink Tea Market Volume Share (%), by Distribution Channel 2025 & 2033
- Figure 31: South America US Ready to Drink Tea Market Revenue (billion), by Country 2025 & 2033
- Figure 32: South America US Ready to Drink Tea Market Volume (K Tons), by Country 2025 & 2033
- Figure 33: South America US Ready to Drink Tea Market Revenue Share (%), by Country 2025 & 2033
- Figure 34: South America US Ready to Drink Tea Market Volume Share (%), by Country 2025 & 2033
- Figure 35: Europe US Ready to Drink Tea Market Revenue (billion), by Soft Drink Type 2025 & 2033
- Figure 36: Europe US Ready to Drink Tea Market Volume (K Tons), by Soft Drink Type 2025 & 2033
- Figure 37: Europe US Ready to Drink Tea Market Revenue Share (%), by Soft Drink Type 2025 & 2033
- Figure 38: Europe US Ready to Drink Tea Market Volume Share (%), by Soft Drink Type 2025 & 2033
- Figure 39: Europe US Ready to Drink Tea Market Revenue (billion), by Packaging Type 2025 & 2033
- Figure 40: Europe US Ready to Drink Tea Market Volume (K Tons), by Packaging Type 2025 & 2033
- Figure 41: Europe US Ready to Drink Tea Market Revenue Share (%), by Packaging Type 2025 & 2033
- Figure 42: Europe US Ready to Drink Tea Market Volume Share (%), by Packaging Type 2025 & 2033
- Figure 43: Europe US Ready to Drink Tea Market Revenue (billion), by Distribution Channel 2025 & 2033
- Figure 44: Europe US Ready to Drink Tea Market Volume (K Tons), by Distribution Channel 2025 & 2033
- Figure 45: Europe US Ready to Drink Tea Market Revenue Share (%), by Distribution Channel 2025 & 2033
- Figure 46: Europe US Ready to Drink Tea Market Volume Share (%), by Distribution Channel 2025 & 2033
- Figure 47: Europe US Ready to Drink Tea Market Revenue (billion), by Country 2025 & 2033
- Figure 48: Europe US Ready to Drink Tea Market Volume (K Tons), by Country 2025 & 2033
- Figure 49: Europe US Ready to Drink Tea Market Revenue Share (%), by Country 2025 & 2033
- Figure 50: Europe US Ready to Drink Tea Market Volume Share (%), by Country 2025 & 2033
- Figure 51: Middle East & Africa US Ready to Drink Tea Market Revenue (billion), by Soft Drink Type 2025 & 2033
- Figure 52: Middle East & Africa US Ready to Drink Tea Market Volume (K Tons), by Soft Drink Type 2025 & 2033
- Figure 53: Middle East & Africa US Ready to Drink Tea Market Revenue Share (%), by Soft Drink Type 2025 & 2033
- Figure 54: Middle East & Africa US Ready to Drink Tea Market Volume Share (%), by Soft Drink Type 2025 & 2033
- Figure 55: Middle East & Africa US Ready to Drink Tea Market Revenue (billion), by Packaging Type 2025 & 2033
- Figure 56: Middle East & Africa US Ready to Drink Tea Market Volume (K Tons), by Packaging Type 2025 & 2033
- Figure 57: Middle East & Africa US Ready to Drink Tea Market Revenue Share (%), by Packaging Type 2025 & 2033
- Figure 58: Middle East & Africa US Ready to Drink Tea Market Volume Share (%), by Packaging Type 2025 & 2033
- Figure 59: Middle East & Africa US Ready to Drink Tea Market Revenue (billion), by Distribution Channel 2025 & 2033
- Figure 60: Middle East & Africa US Ready to Drink Tea Market Volume (K Tons), by Distribution Channel 2025 & 2033
- Figure 61: Middle East & Africa US Ready to Drink Tea Market Revenue Share (%), by Distribution Channel 2025 & 2033
- Figure 62: Middle East & Africa US Ready to Drink Tea Market Volume Share (%), by Distribution Channel 2025 & 2033
- Figure 63: Middle East & Africa US Ready to Drink Tea Market Revenue (billion), by Country 2025 & 2033
- Figure 64: Middle East & Africa US Ready to Drink Tea Market Volume (K Tons), by Country 2025 & 2033
- Figure 65: Middle East & Africa US Ready to Drink Tea Market Revenue Share (%), by Country 2025 & 2033
- Figure 66: Middle East & Africa US Ready to Drink Tea Market Volume Share (%), by Country 2025 & 2033
- Figure 67: Asia Pacific US Ready to Drink Tea Market Revenue (billion), by Soft Drink Type 2025 & 2033
- Figure 68: Asia Pacific US Ready to Drink Tea Market Volume (K Tons), by Soft Drink Type 2025 & 2033
- Figure 69: Asia Pacific US Ready to Drink Tea Market Revenue Share (%), by Soft Drink Type 2025 & 2033
- Figure 70: Asia Pacific US Ready to Drink Tea Market Volume Share (%), by Soft Drink Type 2025 & 2033
- Figure 71: Asia Pacific US Ready to Drink Tea Market Revenue (billion), by Packaging Type 2025 & 2033
- Figure 72: Asia Pacific US Ready to Drink Tea Market Volume (K Tons), by Packaging Type 2025 & 2033
- Figure 73: Asia Pacific US Ready to Drink Tea Market Revenue Share (%), by Packaging Type 2025 & 2033
- Figure 74: Asia Pacific US Ready to Drink Tea Market Volume Share (%), by Packaging Type 2025 & 2033
- Figure 75: Asia Pacific US Ready to Drink Tea Market Revenue (billion), by Distribution Channel 2025 & 2033
- Figure 76: Asia Pacific US Ready to Drink Tea Market Volume (K Tons), by Distribution Channel 2025 & 2033
- Figure 77: Asia Pacific US Ready to Drink Tea Market Revenue Share (%), by Distribution Channel 2025 & 2033
- Figure 78: Asia Pacific US Ready to Drink Tea Market Volume Share (%), by Distribution Channel 2025 & 2033
- Figure 79: Asia Pacific US Ready to Drink Tea Market Revenue (billion), by Country 2025 & 2033
- Figure 80: Asia Pacific US Ready to Drink Tea Market Volume (K Tons), by Country 2025 & 2033
- Figure 81: Asia Pacific US Ready to Drink Tea Market Revenue Share (%), by Country 2025 & 2033
- Figure 82: Asia Pacific US Ready to Drink Tea Market Volume Share (%), by Country 2025 & 2033
List of Tables
- Table 1: Global US Ready to Drink Tea Market Revenue billion Forecast, by Soft Drink Type 2020 & 2033
- Table 2: Global US Ready to Drink Tea Market Volume K Tons Forecast, by Soft Drink Type 2020 & 2033
- Table 3: Global US Ready to Drink Tea Market Revenue billion Forecast, by Packaging Type 2020 & 2033
- Table 4: Global US Ready to Drink Tea Market Volume K Tons Forecast, by Packaging Type 2020 & 2033
- Table 5: Global US Ready to Drink Tea Market Revenue billion Forecast, by Distribution Channel 2020 & 2033
- Table 6: Global US Ready to Drink Tea Market Volume K Tons Forecast, by Distribution Channel 2020 & 2033
- Table 7: Global US Ready to Drink Tea Market Revenue billion Forecast, by Region 2020 & 2033
- Table 8: Global US Ready to Drink Tea Market Volume K Tons Forecast, by Region 2020 & 2033
- Table 9: Global US Ready to Drink Tea Market Revenue billion Forecast, by Soft Drink Type 2020 & 2033
- Table 10: Global US Ready to Drink Tea Market Volume K Tons Forecast, by Soft Drink Type 2020 & 2033
- Table 11: Global US Ready to Drink Tea Market Revenue billion Forecast, by Packaging Type 2020 & 2033
- Table 12: Global US Ready to Drink Tea Market Volume K Tons Forecast, by Packaging Type 2020 & 2033
- Table 13: Global US Ready to Drink Tea Market Revenue billion Forecast, by Distribution Channel 2020 & 2033
- Table 14: Global US Ready to Drink Tea Market Volume K Tons Forecast, by Distribution Channel 2020 & 2033
- Table 15: Global US Ready to Drink Tea Market Revenue billion Forecast, by Country 2020 & 2033
- Table 16: Global US Ready to Drink Tea Market Volume K Tons Forecast, by Country 2020 & 2033
- Table 17: United States US Ready to Drink Tea Market Revenue (billion) Forecast, by Application 2020 & 2033
- Table 18: United States US Ready to Drink Tea Market Volume (K Tons) Forecast, by Application 2020 & 2033
- Table 19: Canada US Ready to Drink Tea Market Revenue (billion) Forecast, by Application 2020 & 2033
- Table 20: Canada US Ready to Drink Tea Market Volume (K Tons) Forecast, by Application 2020 & 2033
- Table 21: Mexico US Ready to Drink Tea Market Revenue (billion) Forecast, by Application 2020 & 2033
- Table 22: Mexico US Ready to Drink Tea Market Volume (K Tons) Forecast, by Application 2020 & 2033
- Table 23: Global US Ready to Drink Tea Market Revenue billion Forecast, by Soft Drink Type 2020 & 2033
- Table 24: Global US Ready to Drink Tea Market Volume K Tons Forecast, by Soft Drink Type 2020 & 2033
- Table 25: Global US Ready to Drink Tea Market Revenue billion Forecast, by Packaging Type 2020 & 2033
- Table 26: Global US Ready to Drink Tea Market Volume K Tons Forecast, by Packaging Type 2020 & 2033
- Table 27: Global US Ready to Drink Tea Market Revenue billion Forecast, by Distribution Channel 2020 & 2033
- Table 28: Global US Ready to Drink Tea Market Volume K Tons Forecast, by Distribution Channel 2020 & 2033
- Table 29: Global US Ready to Drink Tea Market Revenue billion Forecast, by Country 2020 & 2033
- Table 30: Global US Ready to Drink Tea Market Volume K Tons Forecast, by Country 2020 & 2033
- Table 31: Brazil US Ready to Drink Tea Market Revenue (billion) Forecast, by Application 2020 & 2033
- Table 32: Brazil US Ready to Drink Tea Market Volume (K Tons) Forecast, by Application 2020 & 2033
- Table 33: Argentina US Ready to Drink Tea Market Revenue (billion) Forecast, by Application 2020 & 2033
- Table 34: Argentina US Ready to Drink Tea Market Volume (K Tons) Forecast, by Application 2020 & 2033
- Table 35: Rest of South America US Ready to Drink Tea Market Revenue (billion) Forecast, by Application 2020 & 2033
- Table 36: Rest of South America US Ready to Drink Tea Market Volume (K Tons) Forecast, by Application 2020 & 2033
- Table 37: Global US Ready to Drink Tea Market Revenue billion Forecast, by Soft Drink Type 2020 & 2033
- Table 38: Global US Ready to Drink Tea Market Volume K Tons Forecast, by Soft Drink Type 2020 & 2033
- Table 39: Global US Ready to Drink Tea Market Revenue billion Forecast, by Packaging Type 2020 & 2033
- Table 40: Global US Ready to Drink Tea Market Volume K Tons Forecast, by Packaging Type 2020 & 2033
- Table 41: Global US Ready to Drink Tea Market Revenue billion Forecast, by Distribution Channel 2020 & 2033
- Table 42: Global US Ready to Drink Tea Market Volume K Tons Forecast, by Distribution Channel 2020 & 2033
- Table 43: Global US Ready to Drink Tea Market Revenue billion Forecast, by Country 2020 & 2033
- Table 44: Global US Ready to Drink Tea Market Volume K Tons Forecast, by Country 2020 & 2033
- Table 45: United Kingdom US Ready to Drink Tea Market Revenue (billion) Forecast, by Application 2020 & 2033
- Table 46: United Kingdom US Ready to Drink Tea Market Volume (K Tons) Forecast, by Application 2020 & 2033
- Table 47: Germany US Ready to Drink Tea Market Revenue (billion) Forecast, by Application 2020 & 2033
- Table 48: Germany US Ready to Drink Tea Market Volume (K Tons) Forecast, by Application 2020 & 2033
- Table 49: France US Ready to Drink Tea Market Revenue (billion) Forecast, by Application 2020 & 2033
- Table 50: France US Ready to Drink Tea Market Volume (K Tons) Forecast, by Application 2020 & 2033
- Table 51: Italy US Ready to Drink Tea Market Revenue (billion) Forecast, by Application 2020 & 2033
- Table 52: Italy US Ready to Drink Tea Market Volume (K Tons) Forecast, by Application 2020 & 2033
- Table 53: Spain US Ready to Drink Tea Market Revenue (billion) Forecast, by Application 2020 & 2033
- Table 54: Spain US Ready to Drink Tea Market Volume (K Tons) Forecast, by Application 2020 & 2033
- Table 55: Russia US Ready to Drink Tea Market Revenue (billion) Forecast, by Application 2020 & 2033
- Table 56: Russia US Ready to Drink Tea Market Volume (K Tons) Forecast, by Application 2020 & 2033
- Table 57: Benelux US Ready to Drink Tea Market Revenue (billion) Forecast, by Application 2020 & 2033
- Table 58: Benelux US Ready to Drink Tea Market Volume (K Tons) Forecast, by Application 2020 & 2033
- Table 59: Nordics US Ready to Drink Tea Market Revenue (billion) Forecast, by Application 2020 & 2033
- Table 60: Nordics US Ready to Drink Tea Market Volume (K Tons) Forecast, by Application 2020 & 2033
- Table 61: Rest of Europe US Ready to Drink Tea Market Revenue (billion) Forecast, by Application 2020 & 2033
- Table 62: Rest of Europe US Ready to Drink Tea Market Volume (K Tons) Forecast, by Application 2020 & 2033
- Table 63: Global US Ready to Drink Tea Market Revenue billion Forecast, by Soft Drink Type 2020 & 2033
- Table 64: Global US Ready to Drink Tea Market Volume K Tons Forecast, by Soft Drink Type 2020 & 2033
- Table 65: Global US Ready to Drink Tea Market Revenue billion Forecast, by Packaging Type 2020 & 2033
- Table 66: Global US Ready to Drink Tea Market Volume K Tons Forecast, by Packaging Type 2020 & 2033
- Table 67: Global US Ready to Drink Tea Market Revenue billion Forecast, by Distribution Channel 2020 & 2033
- Table 68: Global US Ready to Drink Tea Market Volume K Tons Forecast, by Distribution Channel 2020 & 2033
- Table 69: Global US Ready to Drink Tea Market Revenue billion Forecast, by Country 2020 & 2033
- Table 70: Global US Ready to Drink Tea Market Volume K Tons Forecast, by Country 2020 & 2033
- Table 71: Turkey US Ready to Drink Tea Market Revenue (billion) Forecast, by Application 2020 & 2033
- Table 72: Turkey US Ready to Drink Tea Market Volume (K Tons) Forecast, by Application 2020 & 2033
- Table 73: Israel US Ready to Drink Tea Market Revenue (billion) Forecast, by Application 2020 & 2033
- Table 74: Israel US Ready to Drink Tea Market Volume (K Tons) Forecast, by Application 2020 & 2033
- Table 75: GCC US Ready to Drink Tea Market Revenue (billion) Forecast, by Application 2020 & 2033
- Table 76: GCC US Ready to Drink Tea Market Volume (K Tons) Forecast, by Application 2020 & 2033
- Table 77: North Africa US Ready to Drink Tea Market Revenue (billion) Forecast, by Application 2020 & 2033
- Table 78: North Africa US Ready to Drink Tea Market Volume (K Tons) Forecast, by Application 2020 & 2033
- Table 79: South Africa US Ready to Drink Tea Market Revenue (billion) Forecast, by Application 2020 & 2033
- Table 80: South Africa US Ready to Drink Tea Market Volume (K Tons) Forecast, by Application 2020 & 2033
- Table 81: Rest of Middle East & Africa US Ready to Drink Tea Market Revenue (billion) Forecast, by Application 2020 & 2033
- Table 82: Rest of Middle East & Africa US Ready to Drink Tea Market Volume (K Tons) Forecast, by Application 2020 & 2033
- Table 83: Global US Ready to Drink Tea Market Revenue billion Forecast, by Soft Drink Type 2020 & 2033
- Table 84: Global US Ready to Drink Tea Market Volume K Tons Forecast, by Soft Drink Type 2020 & 2033
- Table 85: Global US Ready to Drink Tea Market Revenue billion Forecast, by Packaging Type 2020 & 2033
- Table 86: Global US Ready to Drink Tea Market Volume K Tons Forecast, by Packaging Type 2020 & 2033
- Table 87: Global US Ready to Drink Tea Market Revenue billion Forecast, by Distribution Channel 2020 & 2033
- Table 88: Global US Ready to Drink Tea Market Volume K Tons Forecast, by Distribution Channel 2020 & 2033
- Table 89: Global US Ready to Drink Tea Market Revenue billion Forecast, by Country 2020 & 2033
- Table 90: Global US Ready to Drink Tea Market Volume K Tons Forecast, by Country 2020 & 2033
- Table 91: China US Ready to Drink Tea Market Revenue (billion) Forecast, by Application 2020 & 2033
- Table 92: China US Ready to Drink Tea Market Volume (K Tons) Forecast, by Application 2020 & 2033
- Table 93: India US Ready to Drink Tea Market Revenue (billion) Forecast, by Application 2020 & 2033
- Table 94: India US Ready to Drink Tea Market Volume (K Tons) Forecast, by Application 2020 & 2033
- Table 95: Japan US Ready to Drink Tea Market Revenue (billion) Forecast, by Application 2020 & 2033
- Table 96: Japan US Ready to Drink Tea Market Volume (K Tons) Forecast, by Application 2020 & 2033
- Table 97: South Korea US Ready to Drink Tea Market Revenue (billion) Forecast, by Application 2020 & 2033
- Table 98: South Korea US Ready to Drink Tea Market Volume (K Tons) Forecast, by Application 2020 & 2033
- Table 99: ASEAN US Ready to Drink Tea Market Revenue (billion) Forecast, by Application 2020 & 2033
- Table 100: ASEAN US Ready to Drink Tea Market Volume (K Tons) Forecast, by Application 2020 & 2033
- Table 101: Oceania US Ready to Drink Tea Market Revenue (billion) Forecast, by Application 2020 & 2033
- Table 102: Oceania US Ready to Drink Tea Market Volume (K Tons) Forecast, by Application 2020 & 2033
- Table 103: Rest of Asia Pacific US Ready to Drink Tea Market Revenue (billion) Forecast, by Application 2020 & 2033
- Table 104: Rest of Asia Pacific US Ready to Drink Tea Market Volume (K Tons) Forecast, by Application 2020 & 2033
Frequently Asked Questions
1. What is the projected Compound Annual Growth Rate (CAGR) of the US Ready to Drink Tea Market?
The projected CAGR is approximately 2.6%.
2. Which companies are prominent players in the US Ready to Drink Tea Market?
Key companies in the market include Red Diamond Inc, Arizona Beverages USA LLC, Milo’s Tea Company Inc, Nestle S A, Ito En Ltd, PepsiCo Inc, Hawaiian Sun Products Inc, Keurig Dr Pepper Inc, The Coca-Cola Company, Del Monte Foods Inc, Reily Foods Company, Walmart Inc.
3. What are the main segments of the US Ready to Drink Tea Market?
The market segments include Soft Drink Type, Packaging Type, Distribution Channel.
4. Can you provide details about the market size?
The market size is estimated to be USD 9.3 billion as of 2022.
5. What are some drivers contributing to market growth?
Increasing demand for meat alternatives.
6. What are the notable trends driving market growth?
OTHER KEY INDUSTRY TRENDS COVERED IN THE REPORT.
7. Are there any restraints impacting market growth?
Presence of numerous alternatives in the plant proteins.
8. Can you provide examples of recent developments in the market?
January 2023: Milo's Tea Company has announced an initial investment of over USD 130 million to construct a new plant and distribution centre in Spartanburg County, South Carolina. This new investment is a direct response to the growth of Milo's brand. Milo expects to start producing its famous tea and lemonade in the fall of 2024.January 2023: Lipton Tea partnered with Full Cart, a program within the nonprofit U.S. Hunger, and a virtual food pantry, to enhance access to heart-friendly nutrition and grocery assistance.December 2022: Pure Leaf rolled out a limited-edition Merry Mint Iced Tea, coinciding with the release of the Christmas movie 'Christmas Class Reunion'. This mint-flavored iced tea was simultaneously launched through a social media giveaway, enhancing the movie-watching experience for consumers.
9. What pricing options are available for accessing the report?
Pricing options include single-user, multi-user, and enterprise licenses priced at USD 3800, USD 4500, and USD 5800 respectively.
10. Is the market size provided in terms of value or volume?
The market size is provided in terms of value, measured in billion and volume, measured in K Tons.
11. Are there any specific market keywords associated with the report?
Yes, the market keyword associated with the report is "US Ready to Drink Tea Market," which aids in identifying and referencing the specific market segment covered.
12. How do I determine which pricing option suits my needs best?
The pricing options vary based on user requirements and access needs. Individual users may opt for single-user licenses, while businesses requiring broader access may choose multi-user or enterprise licenses for cost-effective access to the report.
13. Are there any additional resources or data provided in the US Ready to Drink Tea Market report?
While the report offers comprehensive insights, it's advisable to review the specific contents or supplementary materials provided to ascertain if additional resources or data are available.
14. How can I stay updated on further developments or reports in the US Ready to Drink Tea Market?
To stay informed about further developments, trends, and reports in the US Ready to Drink Tea Market, consider subscribing to industry newsletters, following relevant companies and organizations, or regularly checking reputable industry news sources and publications.
Methodology
Step 1 - Identification of Relevant Samples Size from Population Database


Step 2 - Approaches for Defining Global Market Size (Value, Volume* & Price*)

Note*: In applicable scenarios
Step 3 - Data Sources
Primary Research
- Web Analytics
- Survey Reports
- Research Institute
- Latest Research Reports
- Opinion Leaders
Secondary Research
- Annual Reports
- White Paper
- Latest Press Release
- Industry Association
- Paid Database
- Investor Presentations

Step 4 - Data Triangulation
Involves using different sources of information in order to increase the validity of a study
These sources are likely to be stakeholders in a program - participants, other researchers, program staff, other community members, and so on.
Then we put all data in single framework & apply various statistical tools to find out the dynamic on the market.
During the analysis stage, feedback from the stakeholder groups would be compared to determine areas of agreement as well as areas of divergence