

Key Insights
The global car rental market within the tourism sector is experiencing significant expansion, propelled by the rising trends in leisure and business travel. Projections indicate a robust Compound Annual Growth Rate (CAGR) of 9.77%. This growth trajectory is expected to culminate in a substantial market valuation, reaching 129.66 billion by 2024, forming the base year for these projections. Key growth drivers include the proliferation of online booking platforms, enhancing accessibility and transparency for consumers. Furthermore, the expanding middle class in emerging economies, particularly in the Asia-Pacific region, is fueling demand for cost-effective and dependable transportation solutions. The increasing preference for self-drive rentals, offering unparalleled flexibility and independence to tourists, is also a pivotal factor reshaping market segmentation. The luxury and premium car rental segments are also showing upward momentum, catering to travelers seeking elevated comfort and distinctive experiences.
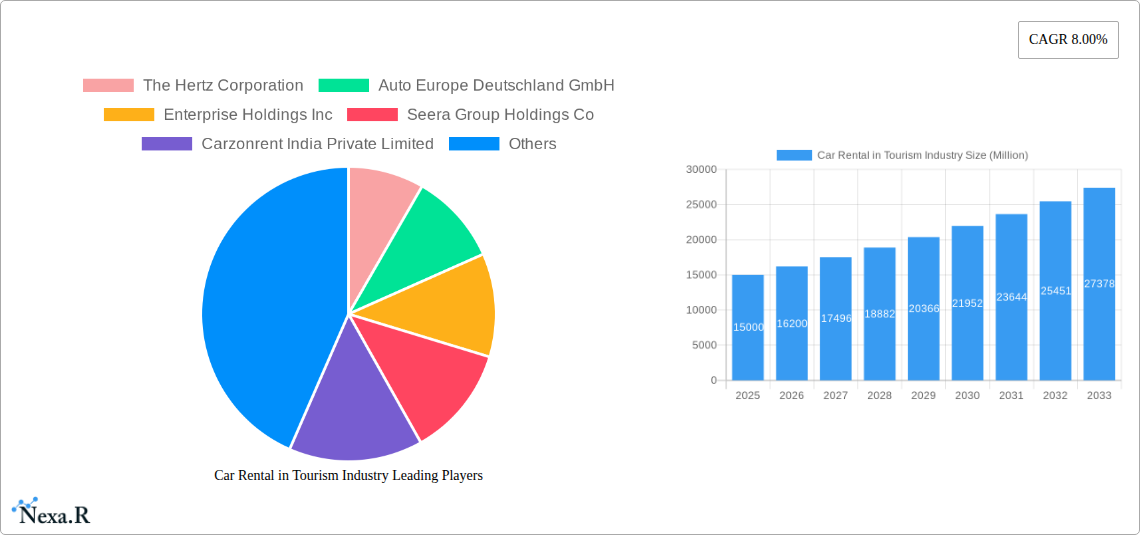
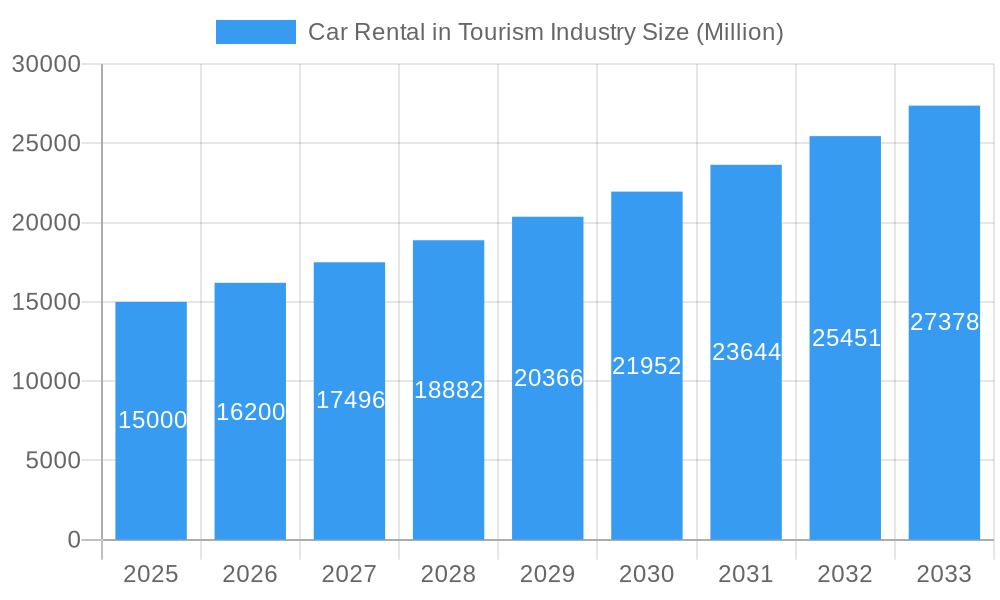
Car Rental in Tourism Industry Market Size (In Billion)
Conversely, market restraints may include volatility in fuel prices, economic downturns impacting discretionary travel budgets, and the growing adoption of alternative transport solutions such as ride-sharing services. The competitive environment is a dynamic mix of established multinational corporations, including Hertz, Enterprise, and Avis Budget Group, alongside agile regional players specializing in niche markets like luxury vehicle hire or airport transfers. Market segmentation by vehicle type (economy, luxury/premium), booking channel (online, offline), and user type (self-drive, rental agencies) provides a detailed perspective on market dynamics and emerging opportunities. Geographically, North America and Europe represent mature markets, while the Asia-Pacific region offers substantial growth potential, driven by its rapidly developing tourism sector and expanding infrastructure.
Car Rental in Tourism Industry Company Market Share
Competitive advantage is increasingly being secured by offering a diverse range of rental solutions tailored to varied budgets and traveler preferences. Companies are strategically adopting technology to streamline operations, elevate customer service standards, and implement innovative pricing models. Collaborations with hospitality, aviation, and travel intermediaries are crucial for expanding market reach and enhancing brand recognition. Navigating this evolving market necessitates adaptability to shifting customer expectations, efficient operational management amidst fluctuating fuel costs, and robust risk mitigation strategies to counter unforeseen economic disruptions. Future growth is anticipated to be spurred by technological advancements, including automated rental processes, sophisticated fleet management systems, and integrated personalized travel planning tools within booking platforms. A commitment to sustainability, demonstrated through the deployment of eco-friendly vehicles and environmentally conscious practices, will be instrumental in shaping the future landscape of the car rental market within the tourism industry.
Car Rental in Tourism Industry: A Comprehensive Market Report (2019-2033)
This in-depth report provides a comprehensive analysis of the car rental market within the tourism industry, offering invaluable insights for industry professionals, investors, and strategic planners. With a focus on market dynamics, growth trends, and key players, this report illuminates the current landscape and forecasts future trajectories, covering the period from 2019 to 2033. The report analyzes key segments including vehicle type (economy, luxury/premium), booking mode (online, offline), and end-users (self-driven, rental agencies). The market is valued at xx Million in 2025 and is projected to reach xx Million by 2033.
Car Rental in Tourism Industry Market Dynamics & Structure
The global car rental market within the tourism sector is characterized by a moderately concentrated structure, with key players like The Hertz Corporation, Enterprise Holdings Inc, Avis Budget Group Inc, and Europcar Mobility Group holding significant market shares. However, the emergence of disruptive players and technological advancements are leading to increased competition. Market concentration is estimated at xx% in 2025, driven by the dominance of established players.
- Technological Innovation: The adoption of mobile booking apps, digital key systems (like Key'n Go), and the integration of car-sharing services are major drivers of innovation. Barriers to innovation include legacy systems in some companies and high initial investment costs for new technologies.
- Regulatory Frameworks: Varying regulations across countries regarding licensing, insurance, and environmental standards significantly influence market dynamics. Inconsistencies create complexities for international expansion.
- Competitive Product Substitutes: Ride-hailing services (Uber, Lyft) and public transportation pose increasing competition, particularly in urban areas.
- End-User Demographics: The rise of millennial and Gen Z travelers, with their preference for online booking and flexible rental options, is reshaping demand. The shift towards experience-based tourism further fuels demand for car rentals, facilitating exploration beyond established tourist routes.
- M&A Trends: The recent acquisition attempts like Volkswagen's bid for Europcar (USD 3.4 billion in 2021) highlight the consolidation trend within the industry, driven by the pursuit of scale and technological integration. The number of M&A deals within the sector averaged xx per year during the historical period (2019-2024).
Car Rental in Tourism Industry Growth Trends & Insights
The car rental market within the tourism industry experienced significant growth between 2019 and 2024, driven by factors like rising disposable incomes, increased travel frequency, and the expansion of the tourism sector globally. Post-pandemic recovery is accelerating the growth trajectory. The market size, estimated at xx Million in 2019, grew to xx Million in 2024 and is forecast to reach xx Million by 2033. The CAGR during the forecast period (2025-2033) is projected to be xx%. This growth is fueled by increasing adoption of online booking platforms, enhancing customer convenience and driving penetration rates.
Technological disruptions, such as the introduction of electric vehicles and autonomous driving technology, are poised to reshape the market landscape. Consumer behavior is shifting towards personalized experiences and sustainable travel options, influencing demand for eco-friendly vehicles and flexible rental packages.
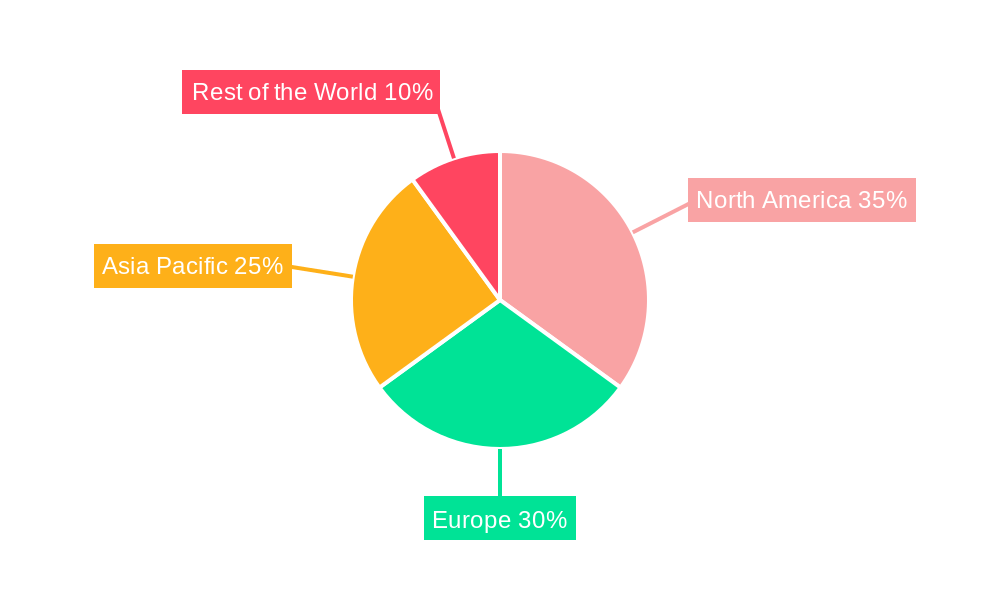
Dominant Regions, Countries, or Segments in Car Rental in Tourism Industry
North America and Europe currently dominate the global car rental market within the tourism industry, accounting for xx% of the global market share in 2025. However, the Asia-Pacific region is showing robust growth potential due to rapid economic development and increasing tourism activity.
- Vehicle Type: The economy segment currently holds the largest market share due to price sensitivity, but the luxury/premium segment is experiencing rapid growth, driven by rising disposable incomes and the desire for enhanced travel experiences.
- Booking Mode: Online booking is gaining traction, surpassing offline booking in several regions, driven by convenience and ease of access.
- End User: Self-driven rentals remain the dominant segment, accounting for xx% of the market. Rental agencies still play a significant role, particularly in organized group tours.
Key Drivers:
- Expanding tourism sector: Growth in international and domestic tourism significantly drives market demand.
- Rising disposable incomes: Increased purchasing power allows more individuals to afford car rentals during their travels.
- Improved infrastructure: Enhanced road networks and airport facilities facilitate better accessibility.
Car Rental in Tourism Industry Product Landscape
The car rental industry is witnessing significant product innovation, focusing on enhancing customer experience and operational efficiency. This includes advancements in online booking platforms, mobile apps with integrated features like GPS navigation and digital keys, and the introduction of electric and hybrid vehicles to meet sustainability goals. The unique selling propositions now focus on speed, convenience, transparency, and environmentally friendly options. Key performance metrics include customer satisfaction, average rental duration, fleet utilization rates, and revenue per vehicle.
Key Drivers, Barriers & Challenges in Car Rental in Tourism Industry
Key Drivers:
- The burgeoning tourism sector fuels demand for convenient transportation solutions.
- Technological advancements simplify booking and enhance the customer journey.
- Government initiatives promoting tourism further propel market growth.
Challenges & Restraints:
- Fluctuations in fuel prices and insurance costs directly impact profitability.
- Stringent regulations and licensing requirements create barriers to entry.
- Intense competition from ride-hailing services and public transportation necessitates strategic differentiation.
Emerging Opportunities in Car Rental in Tourism Industry
- Expanding into underserved markets in developing economies presents significant growth potential.
- Integrating innovative technologies such as autonomous driving and subscription models offers lucrative opportunities.
- Catering to niche segments like eco-conscious travelers through electric vehicle rentals presents an avenue for growth.
Growth Accelerators in the Car Rental in Tourism Industry Industry
Strategic partnerships with hotels, airlines, and tour operators broaden market reach and enhance customer loyalty. Technological advancements, such as AI-powered pricing optimization and predictive maintenance, improve efficiency and reduce operational costs. Expansion into emerging markets with strong tourism growth potential further fuels long-term expansion.
Key Players Shaping the Car Rental in Tourism Industry Market
- The Hertz Corporation
- Auto Europe Deutschland GmbH
- Enterprise Holdings Inc
- Seera Group Holdings Co
- Carzonrent India Private Limited
- Sixt SE
- ZoomCar Inc
- Europcar Mobility Group
- Avis Budget Group Inc
Notable Milestones in Car Rental in Tourism Industry Sector
- February 2021: Theeb Rent a Car expands its fleet in Saudi Arabia with 1,700 new vehicles, demonstrating market growth and diversification of offerings.
- July 2021: Europcar's Key'n Go introduces a fully digital rental experience in 35 Southern European airports, highlighting technological advancements in customer convenience.
- November 2021: Hertz partners with Tesla, procuring 100,000 Model 3s, signifying a shift towards electric vehicle integration within the rental fleet.
- December 2021: Volkswagen's planned acquisition of Europcar for USD 3.4 billion signifies industry consolidation and expansion into new markets.
- January 2022: ekar launches its car subscription service in Thailand, introducing a new business model within the market.
In-Depth Car Rental in Tourism Industry Market Outlook
The car rental market within the tourism sector is poised for sustained growth, driven by continuous technological innovation, expanding tourism, and increasing disposable incomes. Strategic partnerships, expansion into untapped markets, and the adoption of sustainable practices will be critical for long-term success. The focus on enhancing customer experience through technology and personalized services will determine market leadership in the coming years. The rising adoption of subscription models and the integration of autonomous vehicles offer significant potential for future market disruption and growth.
Car Rental in Tourism Industry Segmentation
-
1. Vehicle Type
- 1.1. Economy
- 1.2. Luxury/Premium
-
2. Booking Mode
- 2.1. Online
- 2.2. Offline
-
3. End User
- 3.1. Self Driven
- 3.2. Rental Agencies
Car Rental in Tourism Industry Segmentation By Geography
-
1. North America
- 1.1. United states
- 1.2. Canada
- 1.3. Rest of North america
-
2. Europe
- 2.1. Germany
- 2.2. United Kingdom
- 2.3. France
- 2.4. Italy
- 2.5. Norway
- 2.6. Netherlands
- 2.7. Rest of Europe
-
3. Asia Pacific
- 3.1. China
- 3.2. India
- 3.3. Japan
- 3.4. South Korea
- 3.5. Rest of Asia Pacific
-
4. Rest of the World
- 4.1. South America
- 4.2. Middle East and Africa
Car Rental in Tourism Industry Regional Market Share
Geographic Coverage of Car Rental in Tourism Industry
Car Rental in Tourism Industry REPORT HIGHLIGHTS
| Aspects | Details |
|---|---|
| Study Period | 2020-2034 |
| Base Year | 2025 |
| Estimated Year | 2026 |
| Forecast Period | 2026-2034 |
| Historical Period | 2020-2025 |
| Growth Rate | CAGR of 9.77% from 2020-2034 |
| Segmentation |
|
Table of Contents
- 1. Introduction
- 1.1. Research Scope
- 1.2. Market Segmentation
- 1.3. Research Objective
- 1.4. Definitions and Assumptions
- 2. Executive Summary
- 2.1. Market Snapshot
- 3. Market Dynamics
- 3.1. Market Drivers
- 3.2. Market Restrains
- 3.3. Market Trends
- 3.4. Market Opportunities
- 4. Market Factor Analysis
- 4.1. Porters Five Forces
- 4.1.1. Bargaining Power of Suppliers
- 4.1.2. Bargaining Power of Buyers
- 4.1.3. Threat of New Entrants
- 4.1.4. Threat of Substitutes
- 4.1.5. Competitive Rivalry
- 4.2. PESTEL analysis
- 4.3. BCG Analysis
- 4.3.1. Stars (High Growth, High Market Share)
- 4.3.2. Cash Cows (Low Growth, High Market Share)
- 4.3.3. Question Mark (High Growth, Low Market Share)
- 4.3.4. Dogs (Low Growth, Low Market Share)
- 4.4. Ansoff Matrix Analysis
- 4.5. Supply Chain Analysis
- 4.6. Regulatory Landscape
- 4.7. Current Market Potential and Opportunity Assessment (TAM–SAM–SOM Framework)
- 4.8. NRP Analyst Note
- 4.1. Porters Five Forces
- 5. Market Analysis, Insights and Forecast 2021-2033
- 5.1. Market Analysis, Insights and Forecast - by Vehicle Type
- 5.1.1. Economy
- 5.1.2. Luxury/Premium
- 5.2. Market Analysis, Insights and Forecast - by Booking Mode
- 5.2.1. Online
- 5.2.2. Offline
- 5.3. Market Analysis, Insights and Forecast - by End User
- 5.3.1. Self Driven
- 5.3.2. Rental Agencies
- 5.4. Market Analysis, Insights and Forecast - by Region
- 5.4.1. North America
- 5.4.2. Europe
- 5.4.3. Asia Pacific
- 5.4.4. Rest of the World
- 5.1. Market Analysis, Insights and Forecast - by Vehicle Type
- 6. Global Car Rental in Tourism Industry Analysis, Insights and Forecast, 2021-2033
- 6.1. Market Analysis, Insights and Forecast - by Vehicle Type
- 6.1.1. Economy
- 6.1.2. Luxury/Premium
- 6.2. Market Analysis, Insights and Forecast - by Booking Mode
- 6.2.1. Online
- 6.2.2. Offline
- 6.3. Market Analysis, Insights and Forecast - by End User
- 6.3.1. Self Driven
- 6.3.2. Rental Agencies
- 6.1. Market Analysis, Insights and Forecast - by Vehicle Type
- 7. North America Car Rental in Tourism Industry Analysis, Insights and Forecast, 2020-2032
- 7.1. Market Analysis, Insights and Forecast - by Vehicle Type
- 7.1.1. Economy
- 7.1.2. Luxury/Premium
- 7.2. Market Analysis, Insights and Forecast - by Booking Mode
- 7.2.1. Online
- 7.2.2. Offline
- 7.3. Market Analysis, Insights and Forecast - by End User
- 7.3.1. Self Driven
- 7.3.2. Rental Agencies
- 7.1. Market Analysis, Insights and Forecast - by Vehicle Type
- 8. Europe Car Rental in Tourism Industry Analysis, Insights and Forecast, 2020-2032
- 8.1. Market Analysis, Insights and Forecast - by Vehicle Type
- 8.1.1. Economy
- 8.1.2. Luxury/Premium
- 8.2. Market Analysis, Insights and Forecast - by Booking Mode
- 8.2.1. Online
- 8.2.2. Offline
- 8.3. Market Analysis, Insights and Forecast - by End User
- 8.3.1. Self Driven
- 8.3.2. Rental Agencies
- 8.1. Market Analysis, Insights and Forecast - by Vehicle Type
- 9. Asia Pacific Car Rental in Tourism Industry Analysis, Insights and Forecast, 2020-2032
- 9.1. Market Analysis, Insights and Forecast - by Vehicle Type
- 9.1.1. Economy
- 9.1.2. Luxury/Premium
- 9.2. Market Analysis, Insights and Forecast - by Booking Mode
- 9.2.1. Online
- 9.2.2. Offline
- 9.3. Market Analysis, Insights and Forecast - by End User
- 9.3.1. Self Driven
- 9.3.2. Rental Agencies
- 9.1. Market Analysis, Insights and Forecast - by Vehicle Type
- 10. Rest of the World Car Rental in Tourism Industry Analysis, Insights and Forecast, 2020-2032
- 10.1. Market Analysis, Insights and Forecast - by Vehicle Type
- 10.1.1. Economy
- 10.1.2. Luxury/Premium
- 10.2. Market Analysis, Insights and Forecast - by Booking Mode
- 10.2.1. Online
- 10.2.2. Offline
- 10.3. Market Analysis, Insights and Forecast - by End User
- 10.3.1. Self Driven
- 10.3.2. Rental Agencies
- 10.1. Market Analysis, Insights and Forecast - by Vehicle Type
- 11. Competitive Analysis
- 11.1. Company Profiles
- 11.1.1 The Hertz Corporation
- 11.1.1.1. Company Overview
- 11.1.1.2. Products
- 11.1.1.3. Company Financials
- 11.1.1.4. SWOT Analysis
- 11.1.2 Auto Europe Deutschland GmbH
- 11.1.2.1. Company Overview
- 11.1.2.2. Products
- 11.1.2.3. Company Financials
- 11.1.2.4. SWOT Analysis
- 11.1.3 Enterprise Holdings Inc
- 11.1.3.1. Company Overview
- 11.1.3.2. Products
- 11.1.3.3. Company Financials
- 11.1.3.4. SWOT Analysis
- 11.1.4 Seera Group Holdings Co
- 11.1.4.1. Company Overview
- 11.1.4.2. Products
- 11.1.4.3. Company Financials
- 11.1.4.4. SWOT Analysis
- 11.1.5 Carzonrent India Private Limited
- 11.1.5.1. Company Overview
- 11.1.5.2. Products
- 11.1.5.3. Company Financials
- 11.1.5.4. SWOT Analysis
- 11.1.6 Sixt SE
- 11.1.6.1. Company Overview
- 11.1.6.2. Products
- 11.1.6.3. Company Financials
- 11.1.6.4. SWOT Analysis
- 11.1.7 ZoomCar Inc
- 11.1.7.1. Company Overview
- 11.1.7.2. Products
- 11.1.7.3. Company Financials
- 11.1.7.4. SWOT Analysis
- 11.1.8 Europcar Mobility Group
- 11.1.8.1. Company Overview
- 11.1.8.2. Products
- 11.1.8.3. Company Financials
- 11.1.8.4. SWOT Analysis
- 11.1.9 Avis Budget Group Inc
- 11.1.9.1. Company Overview
- 11.1.9.2. Products
- 11.1.9.3. Company Financials
- 11.1.9.4. SWOT Analysis
- 11.1.1 The Hertz Corporation
- 11.2. Market Entropy
- 11.2.1 Company's Key Areas Served
- 11.2.2 Recent Developments
- 11.3. Company Market Share Analysis 2025
- 11.3.1 Top 5 Companies Market Share Analysis
- 11.3.2 Top 3 Companies Market Share Analysis
- 11.4. List of Potential Customers
- 12. Research Methodology
List of Figures
- Figure 1: Global Car Rental in Tourism Industry Revenue Breakdown (billion, %) by Region 2025 & 2033
- Figure 2: North America Car Rental in Tourism Industry Revenue (billion), by Vehicle Type 2025 & 2033
- Figure 3: North America Car Rental in Tourism Industry Revenue Share (%), by Vehicle Type 2025 & 2033
- Figure 4: North America Car Rental in Tourism Industry Revenue (billion), by Booking Mode 2025 & 2033
- Figure 5: North America Car Rental in Tourism Industry Revenue Share (%), by Booking Mode 2025 & 2033
- Figure 6: North America Car Rental in Tourism Industry Revenue (billion), by End User 2025 & 2033
- Figure 7: North America Car Rental in Tourism Industry Revenue Share (%), by End User 2025 & 2033
- Figure 8: North America Car Rental in Tourism Industry Revenue (billion), by Country 2025 & 2033
- Figure 9: North America Car Rental in Tourism Industry Revenue Share (%), by Country 2025 & 2033
- Figure 10: Europe Car Rental in Tourism Industry Revenue (billion), by Vehicle Type 2025 & 2033
- Figure 11: Europe Car Rental in Tourism Industry Revenue Share (%), by Vehicle Type 2025 & 2033
- Figure 12: Europe Car Rental in Tourism Industry Revenue (billion), by Booking Mode 2025 & 2033
- Figure 13: Europe Car Rental in Tourism Industry Revenue Share (%), by Booking Mode 2025 & 2033
- Figure 14: Europe Car Rental in Tourism Industry Revenue (billion), by End User 2025 & 2033
- Figure 15: Europe Car Rental in Tourism Industry Revenue Share (%), by End User 2025 & 2033
- Figure 16: Europe Car Rental in Tourism Industry Revenue (billion), by Country 2025 & 2033
- Figure 17: Europe Car Rental in Tourism Industry Revenue Share (%), by Country 2025 & 2033
- Figure 18: Asia Pacific Car Rental in Tourism Industry Revenue (billion), by Vehicle Type 2025 & 2033
- Figure 19: Asia Pacific Car Rental in Tourism Industry Revenue Share (%), by Vehicle Type 2025 & 2033
- Figure 20: Asia Pacific Car Rental in Tourism Industry Revenue (billion), by Booking Mode 2025 & 2033
- Figure 21: Asia Pacific Car Rental in Tourism Industry Revenue Share (%), by Booking Mode 2025 & 2033
- Figure 22: Asia Pacific Car Rental in Tourism Industry Revenue (billion), by End User 2025 & 2033
- Figure 23: Asia Pacific Car Rental in Tourism Industry Revenue Share (%), by End User 2025 & 2033
- Figure 24: Asia Pacific Car Rental in Tourism Industry Revenue (billion), by Country 2025 & 2033
- Figure 25: Asia Pacific Car Rental in Tourism Industry Revenue Share (%), by Country 2025 & 2033
- Figure 26: Rest of the World Car Rental in Tourism Industry Revenue (billion), by Vehicle Type 2025 & 2033
- Figure 27: Rest of the World Car Rental in Tourism Industry Revenue Share (%), by Vehicle Type 2025 & 2033
- Figure 28: Rest of the World Car Rental in Tourism Industry Revenue (billion), by Booking Mode 2025 & 2033
- Figure 29: Rest of the World Car Rental in Tourism Industry Revenue Share (%), by Booking Mode 2025 & 2033
- Figure 30: Rest of the World Car Rental in Tourism Industry Revenue (billion), by End User 2025 & 2033
- Figure 31: Rest of the World Car Rental in Tourism Industry Revenue Share (%), by End User 2025 & 2033
- Figure 32: Rest of the World Car Rental in Tourism Industry Revenue (billion), by Country 2025 & 2033
- Figure 33: Rest of the World Car Rental in Tourism Industry Revenue Share (%), by Country 2025 & 2033
List of Tables
- Table 1: Global Car Rental in Tourism Industry Revenue billion Forecast, by Vehicle Type 2020 & 2033
- Table 2: Global Car Rental in Tourism Industry Revenue billion Forecast, by Booking Mode 2020 & 2033
- Table 3: Global Car Rental in Tourism Industry Revenue billion Forecast, by End User 2020 & 2033
- Table 4: Global Car Rental in Tourism Industry Revenue billion Forecast, by Region 2020 & 2033
- Table 5: Global Car Rental in Tourism Industry Revenue billion Forecast, by Vehicle Type 2020 & 2033
- Table 6: Global Car Rental in Tourism Industry Revenue billion Forecast, by Booking Mode 2020 & 2033
- Table 7: Global Car Rental in Tourism Industry Revenue billion Forecast, by End User 2020 & 2033
- Table 8: Global Car Rental in Tourism Industry Revenue billion Forecast, by Country 2020 & 2033
- Table 9: United states Car Rental in Tourism Industry Revenue (billion) Forecast, by Application 2020 & 2033
- Table 10: Canada Car Rental in Tourism Industry Revenue (billion) Forecast, by Application 2020 & 2033
- Table 11: Rest of North america Car Rental in Tourism Industry Revenue (billion) Forecast, by Application 2020 & 2033
- Table 12: Global Car Rental in Tourism Industry Revenue billion Forecast, by Vehicle Type 2020 & 2033
- Table 13: Global Car Rental in Tourism Industry Revenue billion Forecast, by Booking Mode 2020 & 2033
- Table 14: Global Car Rental in Tourism Industry Revenue billion Forecast, by End User 2020 & 2033
- Table 15: Global Car Rental in Tourism Industry Revenue billion Forecast, by Country 2020 & 2033
- Table 16: Germany Car Rental in Tourism Industry Revenue (billion) Forecast, by Application 2020 & 2033
- Table 17: United Kingdom Car Rental in Tourism Industry Revenue (billion) Forecast, by Application 2020 & 2033
- Table 18: France Car Rental in Tourism Industry Revenue (billion) Forecast, by Application 2020 & 2033
- Table 19: Italy Car Rental in Tourism Industry Revenue (billion) Forecast, by Application 2020 & 2033
- Table 20: Norway Car Rental in Tourism Industry Revenue (billion) Forecast, by Application 2020 & 2033
- Table 21: Netherlands Car Rental in Tourism Industry Revenue (billion) Forecast, by Application 2020 & 2033
- Table 22: Rest of Europe Car Rental in Tourism Industry Revenue (billion) Forecast, by Application 2020 & 2033
- Table 23: Global Car Rental in Tourism Industry Revenue billion Forecast, by Vehicle Type 2020 & 2033
- Table 24: Global Car Rental in Tourism Industry Revenue billion Forecast, by Booking Mode 2020 & 2033
- Table 25: Global Car Rental in Tourism Industry Revenue billion Forecast, by End User 2020 & 2033
- Table 26: Global Car Rental in Tourism Industry Revenue billion Forecast, by Country 2020 & 2033
- Table 27: China Car Rental in Tourism Industry Revenue (billion) Forecast, by Application 2020 & 2033
- Table 28: India Car Rental in Tourism Industry Revenue (billion) Forecast, by Application 2020 & 2033
- Table 29: Japan Car Rental in Tourism Industry Revenue (billion) Forecast, by Application 2020 & 2033
- Table 30: South Korea Car Rental in Tourism Industry Revenue (billion) Forecast, by Application 2020 & 2033
- Table 31: Rest of Asia Pacific Car Rental in Tourism Industry Revenue (billion) Forecast, by Application 2020 & 2033
- Table 32: Global Car Rental in Tourism Industry Revenue billion Forecast, by Vehicle Type 2020 & 2033
- Table 33: Global Car Rental in Tourism Industry Revenue billion Forecast, by Booking Mode 2020 & 2033
- Table 34: Global Car Rental in Tourism Industry Revenue billion Forecast, by End User 2020 & 2033
- Table 35: Global Car Rental in Tourism Industry Revenue billion Forecast, by Country 2020 & 2033
- Table 36: South America Car Rental in Tourism Industry Revenue (billion) Forecast, by Application 2020 & 2033
- Table 37: Middle East and Africa Car Rental in Tourism Industry Revenue (billion) Forecast, by Application 2020 & 2033
Frequently Asked Questions
1. What is the projected Compound Annual Growth Rate (CAGR) of the Car Rental in Tourism Industry?
The projected CAGR is approximately 9.77%.
2. Which companies are prominent players in the Car Rental in Tourism Industry?
Key companies in the market include The Hertz Corporation, Auto Europe Deutschland GmbH, Enterprise Holdings Inc, Seera Group Holdings Co, Carzonrent India Private Limited, Sixt SE, ZoomCar Inc, Europcar Mobility Group, Avis Budget Group Inc.
3. What are the main segments of the Car Rental in Tourism Industry?
The market segments include Vehicle Type, Booking Mode, End User.
4. Can you provide details about the market size?
The market size is estimated to be USD 129.66 billion as of 2022.
5. What are some drivers contributing to market growth?
Growing Use of Aluminum in Die Casting Equipment to Increase Market Demand.
6. What are the notable trends driving market growth?
Online Booking Expected to Witness Significant Growth during the Forecast Period.
7. Are there any restraints impacting market growth?
Fluctuations in Raw Material Prices.
8. Can you provide examples of recent developments in the market?
In January 2022, ekar, the Middle East's mobility company, launched its operations in Thailand starting with Bangkok and with plans to expand into other countries. ekar is launching its proprietary car subscription service which offers cars from one to nine-month terms for a single monthly subscription cost with no down payments or long-term commitments via the ekar app.
9. What pricing options are available for accessing the report?
Pricing options include single-user, multi-user, and enterprise licenses priced at USD 4750, USD 5250, and USD 8750 respectively.
10. Is the market size provided in terms of value or volume?
The market size is provided in terms of value, measured in billion.
11. Are there any specific market keywords associated with the report?
Yes, the market keyword associated with the report is "Car Rental in Tourism Industry," which aids in identifying and referencing the specific market segment covered.
12. How do I determine which pricing option suits my needs best?
The pricing options vary based on user requirements and access needs. Individual users may opt for single-user licenses, while businesses requiring broader access may choose multi-user or enterprise licenses for cost-effective access to the report.
13. Are there any additional resources or data provided in the Car Rental in Tourism Industry report?
While the report offers comprehensive insights, it's advisable to review the specific contents or supplementary materials provided to ascertain if additional resources or data are available.
14. How can I stay updated on further developments or reports in the Car Rental in Tourism Industry?
To stay informed about further developments, trends, and reports in the Car Rental in Tourism Industry, consider subscribing to industry newsletters, following relevant companies and organizations, or regularly checking reputable industry news sources and publications.
Methodology
Step 1 - Identification of Relevant Samples Size from Population Database


Step 2 - Approaches for Defining Global Market Size (Value, Volume* & Price*)

Note*: In applicable scenarios
Step 3 - Data Sources
Primary Research
- Web Analytics
- Survey Reports
- Research Institute
- Latest Research Reports
- Opinion Leaders
Secondary Research
- Annual Reports
- White Paper
- Latest Press Release
- Industry Association
- Paid Database
- Investor Presentations

Step 4 - Data Triangulation
Involves using different sources of information in order to increase the validity of a study
These sources are likely to be stakeholders in a program - participants, other researchers, program staff, other community members, and so on.
Then we put all data in single framework & apply various statistical tools to find out the dynamic on the market.
During the analysis stage, feedback from the stakeholder groups would be compared to determine areas of agreement as well as areas of divergence