

Key Insights
The Electroluminescent Display (ELD) market is projected for substantial growth, anticipated to reach $3.4 billion by 2024, with a Compound Annual Growth Rate (CAGR) of 6.5% through 2033. This expansion is driven by escalating demand for specialized display solutions across various industries. The defense sector is a primary adopter, utilizing ELDs for their superior contrast, wide viewing angles, and exceptional low-light performance in tactical displays and control panels. The medical industry is also increasingly integrating ELDs into diagnostic imaging and patient monitoring devices, benefiting from their clarity and reliability. Advances in thin-film technology are enabling slimmer, more flexible, and energy-efficient ELD panels, expanding applications in automotive dashboards, industrial controls, portable electronics, and architectural lighting. The "Others" segment, encompassing emerging applications, is expected to see significant growth as ELD technology finds new use cases.
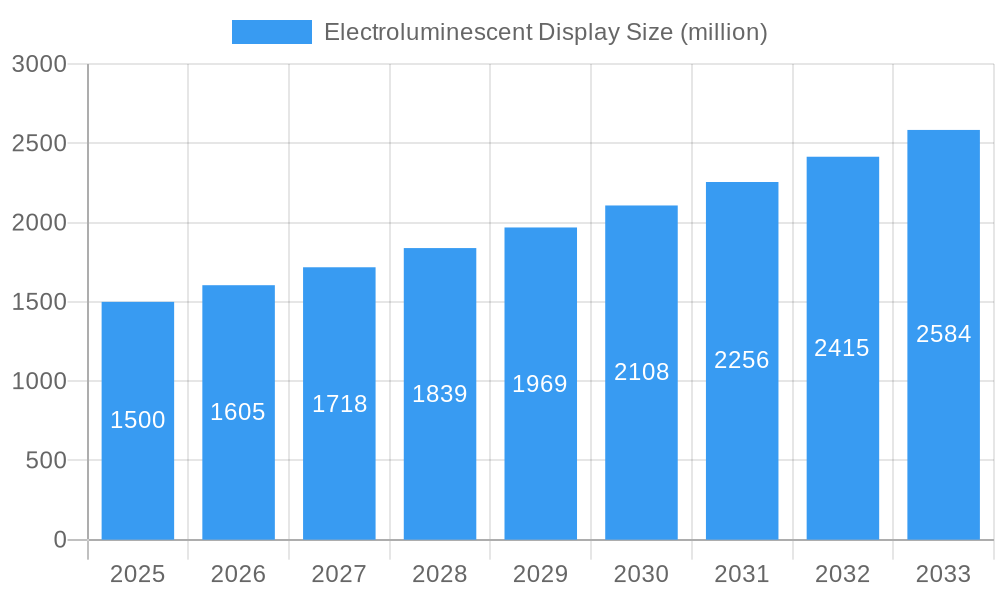
Electroluminescent Display Market Size (In Billion)
Continuous innovation in ELD technology, leading to enhanced brightness, color accuracy, and longevity, further fuels market expansion. The adoption of transparent thin-film electroluminescent displays is a key trend, facilitating novel user interfaces and augmented reality applications. Challenges include manufacturing costs, which can be higher than alternative solutions like LCD and OLED, and potentially lower pixel density for ultra-high-resolution consumer electronics. However, research and development are actively addressing these limitations to improve cost-effectiveness and resolution. Geographically, Asia Pacific is expected to lead market growth due to its robust electronics manufacturing sector, followed by North America and Europe, driven by their strong defense and medical industries.
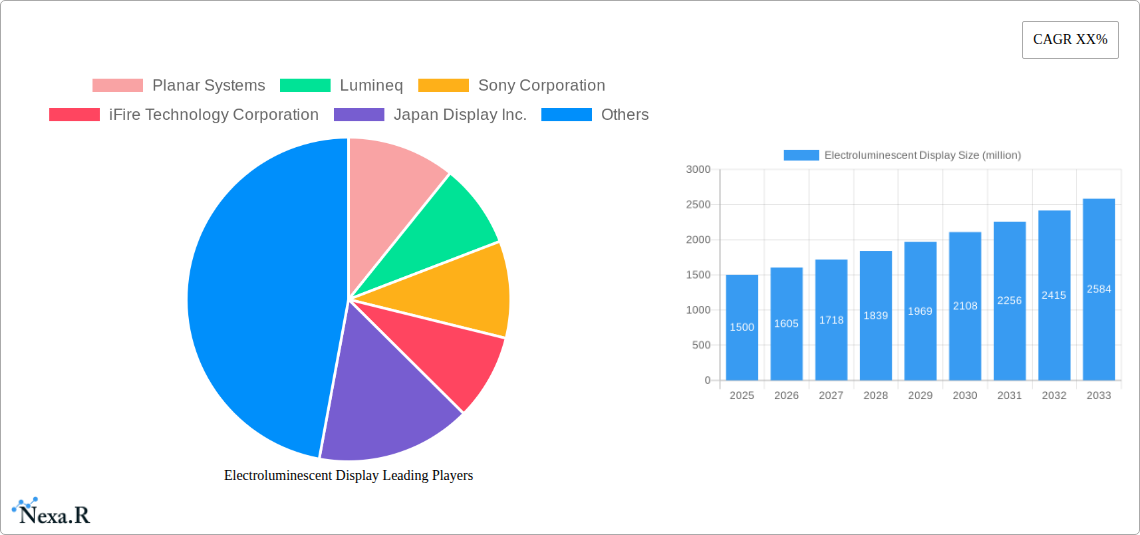
Electroluminescent Display Company Market Share
Electroluminescent Display Market Analysis: Innovation, Growth, and Strategic Opportunities (2019-2033)
This comprehensive report offers an in-depth analysis of the global Electroluminescent (EL) Display market, projecting its trajectory from 2019 to 2033, with a base year of 2025. We delve into market dynamics, growth trends, regional dominance, product landscapes, key drivers and challenges, emerging opportunities, and the strategic moves of leading players. This report is essential for industry professionals seeking to understand the evolving market, capitalize on emerging trends, and make informed strategic decisions. The global market is projected to reach $3,500 million units in 2025.
Electroluminescent Display Market Dynamics & Structure
The Electroluminescent Display market is characterized by a moderate to high concentration, with key players like Planar Systems, Lumineq, Sony Corporation, iFire Technology Corporation, and Japan Display Inc. investing heavily in technological innovation. The primary drivers are the increasing demand for high-brightness, thin, and energy-efficient displays across diverse applications. Regulatory frameworks, particularly concerning energy efficiency and hazardous materials, are shaping product development and adoption. Competitive product substitutes, such as OLED and MicroLED displays, present a significant challenge, pushing EL display manufacturers to focus on niche applications and cost-effectiveness. End-user demographics are shifting towards industries demanding robust and reliable display solutions in challenging environments. M&A trends are anticipated to increase as larger companies seek to acquire specialized EL display technologies or expand their market reach.
- Market Concentration: Moderate to High, with consolidation expected.
- Technological Innovation Drivers: Energy efficiency, brightness, thin form factors, cost reduction.
- Regulatory Frameworks: Energy efficiency standards, RoHS compliance.
- Competitive Product Substitutes: OLED, MicroLED, traditional LCD.
- End-User Demographics: Industrial, automotive, medical, defense sectors.
- M&A Trends: Focus on niche technology acquisition and market expansion.
Electroluminescent Display Growth Trends & Insights
The global Electroluminescent Display market is poised for significant expansion, driven by the inherent advantages of EL technology in specific application areas. The market size is expected to witness a Compound Annual Growth Rate (CAGR) of 6.8% from 2025 to 2033, reaching an estimated $5,950 million units by 2033. Adoption rates are steadily increasing in niche segments where superior brightness, contrast, and the ability to operate in extreme temperatures are paramount. Technological disruptions are not solely about new display types but also about the refinement of EL materials and manufacturing processes, leading to improved lifespan, color accuracy, and power consumption. Consumer behavior shifts, while less directly impactful on industrial EL displays, are indirectly influencing demand through the need for more integrated and visually appealing interfaces in connected devices and vehicles.
The market penetration of EL displays, while lower than mainstream technologies like LCD or OLED, is growing in specialized sectors. For instance, in the automotive sector, the demand for robust and high-visibility displays for instrument clusters and head-up displays (HUDs) is a key growth driver. Similarly, the medical industry relies on EL displays for their consistent brightness and reliability in diagnostic imaging and patient monitoring equipment. The defense sector's requirement for durable and visually distinct displays in harsh operating conditions further fuels market expansion. Innovations in transparent EL displays are opening up new avenues in architectural design and augmented reality applications. The projected market size for EL displays in 2025 is $3,500 million units, highlighting the substantial growth potential over the forecast period. The continuous evolution of manufacturing techniques, coupled with strategic investments in research and development, will be crucial in overcoming cost barriers and expanding market reach beyond current niche applications. The demand for customizable and ruggedized display solutions is a strong indicator of sustained growth.
Dominant Regions, Countries, or Segments in Electroluminescent Display
The Asia-Pacific region is currently the dominant force in the Electroluminescent Display market, driven by a robust manufacturing ecosystem, significant investments in R&D, and a burgeoning demand across key application segments. Countries like China, Japan, and South Korea are at the forefront, housing major display manufacturers and research institutions. The dominance is further bolstered by favorable government policies promoting technological advancements and the production of advanced display technologies.
Key Drivers for Asia-Pacific's Dominance:
- Manufacturing Hub: Presence of major electronics manufacturing facilities and supply chains.
- Technological Innovation: Significant R&D expenditure by leading companies, including Japan Display Inc. and Sony Corporation, pushing the boundaries of EL display technology.
- Growing Application Segments: High demand from the automotive, consumer electronics, and industrial sectors within the region.
- Government Support: Policies encouraging the development and adoption of advanced display technologies.
Within the application segments, the Transportation sector is a significant growth driver, particularly in automotive and aerospace. The need for high-brightness, wide-viewing angle, and durable displays for instrument clusters, infotainment systems, and cockpit displays is escalating. The Medical application segment also exhibits strong growth due to the requirement for reliable and consistent illumination in diagnostic equipment and patient monitoring devices.
The Non-Transparent Thin Film Electroluminescent Display segment currently holds the larger market share due to its established applications in industrial controls, automotive dashboards, and consumer electronics. However, the Transparent Thin Film Electroluminescent Display segment is experiencing a higher growth rate, fueled by emerging applications in smart windows, augmented reality devices, and architectural displays. The projected market share for Non-Transparent Thin Film Electroluminescent Displays in 2025 is approximately 75%, while Transparent Thin Film Electroluminescent Displays account for around 25%. This dynamic is expected to shift gradually as transparent EL technology matures and finds wider commercial adoption. The continued investment by companies like Planar Systems and Lumineq in developing advanced EL solutions for these demanding applications is a testament to the region's and these segments' strategic importance.
Electroluminescent Display Product Landscape
The Electroluminescent Display product landscape is defined by its unique ability to emit light directly from a luminescent material when an electric current is applied. This results in exceptionally thin, bright, and wide-viewing angle displays. Innovations are focused on enhancing color purity, improving energy efficiency, extending operational lifespan, and reducing manufacturing costs. Transparent Thin Film Electroluminescent Displays offer a compelling solution for integration into glass surfaces, enabling interactive displays and augmented reality overlays. Non-Transparent Thin Film Electroluminescent Displays continue to be refined for high-performance applications demanding exceptional contrast ratios and rapid response times, making them ideal for industrial control panels, automotive dashboards, and medical instrumentation.
Key Drivers, Barriers & Challenges in Electroluminescent Display
Key Drivers:
- Superior Brightness and Contrast: Essential for visibility in diverse lighting conditions, particularly in automotive and industrial settings.
- Thin Form Factor and Flexibility: Enables novel design possibilities and integration into compact devices.
- Low Power Consumption: Crucial for battery-operated devices and energy-efficient solutions.
- Wide Viewing Angles: Ensures readability from various perspectives, enhancing user experience.
- Durability and Ruggedness: Ideal for harsh environments encountered in defense, industrial, and transportation applications.
Key Barriers & Challenges:
- Manufacturing Complexity and Cost: High initial investment and specialized processes can lead to higher per-unit costs compared to some competing technologies.
- Limited Color Gamut and Luminance Uniformity: Historically, EL displays have faced challenges in achieving the color richness and uniformity seen in OLEDs, although advancements are being made.
- Lifespan and Degradation: While improving, the operational lifespan and potential for degradation under continuous use remain a concern for certain high-end applications.
- Competition from Mature Technologies: OLED and advanced LCD technologies offer competitive performance and established supply chains.
- Supply Chain Vulnerabilities: Reliance on specialized materials and manufacturing equipment can create supply chain risks. The projected impact of these challenges on market growth is estimated to be around 10-15% in terms of delayed adoption in certain segments.
Emerging Opportunities in Electroluminescent Display
Emerging opportunities in the Electroluminescent Display sector lie in the expansion of transparent EL displays into architectural glazing, interactive retail displays, and advanced heads-up displays (HUDs) for vehicles and aircraft. The development of flexible and foldable EL displays presents a significant opportunity for wearable technology and next-generation consumer electronics. Furthermore, the increasing demand for ruggedized and reliable displays in the Internet of Things (IoT) devices and industrial automation systems offers a substantial growth avenue. The potential for integration into smart signage and digital out-of-home (DOOH) advertising solutions, leveraging their high brightness and energy efficiency, is also a promising area.
Growth Accelerators in the Electroluminescent Display Industry
Growth accelerators in the Electroluminescent Display industry are primarily driven by continuous technological breakthroughs in material science, leading to improved efficiency, color performance, and lifespan. Strategic partnerships between EL display manufacturers and system integrators in key application sectors, such as automotive and medical, are crucial for driving adoption. Market expansion strategies, including a focus on cost reduction through advanced manufacturing techniques and exploring new geographical markets with growing industrial bases, will further fuel growth. The increasing emphasis on energy-efficient solutions across all industries also acts as a significant accelerator for EL display technology.
Key Players Shaping the Electroluminescent Display Market
- Planar Systems
- Lumineq
- Sony Corporation
- iFire Technology Corporation
- Japan Display Inc.
Notable Milestones in Electroluminescent Display Sector
- 2019: Continued advancements in phosphorescent EL materials leading to improved efficiency and color saturation.
- 2020: Increased adoption of transparent EL displays in niche architectural and automotive applications.
- 2021: Development of more robust and longer-lasting EL backlights for industrial displays.
- 2022: Focus on cost optimization through automated manufacturing processes.
- 2023: Enhanced integration of EL displays into advanced driver-assistance systems (ADAS).
- 2024: Exploration of novel EL display architectures for augmented reality and virtual reality applications.
In-Depth Electroluminescent Display Market Outlook
The Electroluminescent Display market outlook is highly optimistic, driven by the inherent technological advantages of EL displays and their growing applicability in specialized and high-performance sectors. Future growth will be propelled by advancements in material science, enabling even greater efficiency and color fidelity, and by the increasing demand for transparent and flexible display solutions. Strategic collaborations and a continued focus on cost-effective manufacturing will be pivotal in expanding market reach. The market is expected to witness sustained growth, with key opportunities arising from innovations in automotive HUDs, medical imaging, industrial automation, and emerging AR/VR applications, collectively projected to contribute to a substantial market expansion over the forecast period.
Electroluminescent Display Segmentation
-
1. Application
- 1.1. Medical
- 1.2. Business
- 1.3. Defense
- 1.4. Transportation
- 1.5. Others
-
2. Types
- 2.1. Transparent Thin Film Electroluminescent Display
- 2.2. Non-Transparent Thin Film Electroluminescent Display
Electroluminescent Display Segmentation By Geography
-
1. North America
- 1.1. United States
- 1.2. Canada
- 1.3. Mexico
-
2. South America
- 2.1. Brazil
- 2.2. Argentina
- 2.3. Rest of South America
-
3. Europe
- 3.1. United Kingdom
- 3.2. Germany
- 3.3. France
- 3.4. Italy
- 3.5. Spain
- 3.6. Russia
- 3.7. Benelux
- 3.8. Nordics
- 3.9. Rest of Europe
-
4. Middle East & Africa
- 4.1. Turkey
- 4.2. Israel
- 4.3. GCC
- 4.4. North Africa
- 4.5. South Africa
- 4.6. Rest of Middle East & Africa
-
5. Asia Pacific
- 5.1. China
- 5.2. India
- 5.3. Japan
- 5.4. South Korea
- 5.5. ASEAN
- 5.6. Oceania
- 5.7. Rest of Asia Pacific
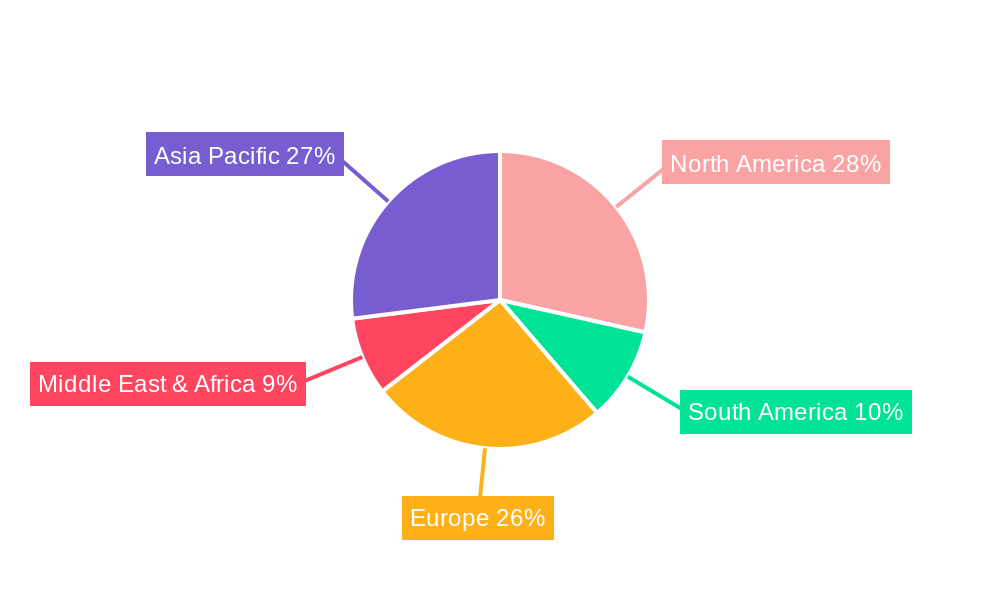
Electroluminescent Display Regional Market Share
Geographic Coverage of Electroluminescent Display
Electroluminescent Display REPORT HIGHLIGHTS
| Aspects | Details |
|---|---|
| Study Period | 2020-2034 |
| Base Year | 2025 |
| Estimated Year | 2026 |
| Forecast Period | 2026-2034 |
| Historical Period | 2020-2025 |
| Growth Rate | CAGR of 6.5% from 2020-2034 |
| Segmentation |
|
Table of Contents
- 1. Introduction
- 1.1. Research Scope
- 1.2. Market Segmentation
- 1.3. Research Objective
- 1.4. Definitions and Assumptions
- 2. Executive Summary
- 2.1. Market Snapshot
- 3. Market Dynamics
- 3.1. Market Drivers
- 3.2. Market Restrains
- 3.3. Market Trends
- 3.4. Market Opportunities
- 4. Market Factor Analysis
- 4.1. Porters Five Forces
- 4.1.1. Bargaining Power of Suppliers
- 4.1.2. Bargaining Power of Buyers
- 4.1.3. Threat of New Entrants
- 4.1.4. Threat of Substitutes
- 4.1.5. Competitive Rivalry
- 4.2. PESTEL analysis
- 4.3. BCG Analysis
- 4.3.1. Stars (High Growth, High Market Share)
- 4.3.2. Cash Cows (Low Growth, High Market Share)
- 4.3.3. Question Mark (High Growth, Low Market Share)
- 4.3.4. Dogs (Low Growth, Low Market Share)
- 4.4. Ansoff Matrix Analysis
- 4.5. Supply Chain Analysis
- 4.6. Regulatory Landscape
- 4.7. Current Market Potential and Opportunity Assessment (TAM–SAM–SOM Framework)
- 4.8. NRP Analyst Note
- 4.1. Porters Five Forces
- 5. Market Analysis, Insights and Forecast 2021-2033
- 5.1. Market Analysis, Insights and Forecast - by Application
- 5.1.1. Medical
- 5.1.2. Business
- 5.1.3. Defense
- 5.1.4. Transportation
- 5.1.5. Others
- 5.2. Market Analysis, Insights and Forecast - by Types
- 5.2.1. Transparent Thin Film Electroluminescent Display
- 5.2.2. Non-Transparent Thin Film Electroluminescent Display
- 5.3. Market Analysis, Insights and Forecast - by Region
- 5.3.1. North America
- 5.3.2. South America
- 5.3.3. Europe
- 5.3.4. Middle East & Africa
- 5.3.5. Asia Pacific
- 5.1. Market Analysis, Insights and Forecast - by Application
- 6. Global Electroluminescent Display Analysis, Insights and Forecast, 2021-2033
- 6.1. Market Analysis, Insights and Forecast - by Application
- 6.1.1. Medical
- 6.1.2. Business
- 6.1.3. Defense
- 6.1.4. Transportation
- 6.1.5. Others
- 6.2. Market Analysis, Insights and Forecast - by Types
- 6.2.1. Transparent Thin Film Electroluminescent Display
- 6.2.2. Non-Transparent Thin Film Electroluminescent Display
- 6.1. Market Analysis, Insights and Forecast - by Application
- 7. North America Electroluminescent Display Analysis, Insights and Forecast, 2020-2032
- 7.1. Market Analysis, Insights and Forecast - by Application
- 7.1.1. Medical
- 7.1.2. Business
- 7.1.3. Defense
- 7.1.4. Transportation
- 7.1.5. Others
- 7.2. Market Analysis, Insights and Forecast - by Types
- 7.2.1. Transparent Thin Film Electroluminescent Display
- 7.2.2. Non-Transparent Thin Film Electroluminescent Display
- 7.1. Market Analysis, Insights and Forecast - by Application
- 8. South America Electroluminescent Display Analysis, Insights and Forecast, 2020-2032
- 8.1. Market Analysis, Insights and Forecast - by Application
- 8.1.1. Medical
- 8.1.2. Business
- 8.1.3. Defense
- 8.1.4. Transportation
- 8.1.5. Others
- 8.2. Market Analysis, Insights and Forecast - by Types
- 8.2.1. Transparent Thin Film Electroluminescent Display
- 8.2.2. Non-Transparent Thin Film Electroluminescent Display
- 8.1. Market Analysis, Insights and Forecast - by Application
- 9. Europe Electroluminescent Display Analysis, Insights and Forecast, 2020-2032
- 9.1. Market Analysis, Insights and Forecast - by Application
- 9.1.1. Medical
- 9.1.2. Business
- 9.1.3. Defense
- 9.1.4. Transportation
- 9.1.5. Others
- 9.2. Market Analysis, Insights and Forecast - by Types
- 9.2.1. Transparent Thin Film Electroluminescent Display
- 9.2.2. Non-Transparent Thin Film Electroluminescent Display
- 9.1. Market Analysis, Insights and Forecast - by Application
- 10. Middle East & Africa Electroluminescent Display Analysis, Insights and Forecast, 2020-2032
- 10.1. Market Analysis, Insights and Forecast - by Application
- 10.1.1. Medical
- 10.1.2. Business
- 10.1.3. Defense
- 10.1.4. Transportation
- 10.1.5. Others
- 10.2. Market Analysis, Insights and Forecast - by Types
- 10.2.1. Transparent Thin Film Electroluminescent Display
- 10.2.2. Non-Transparent Thin Film Electroluminescent Display
- 10.1. Market Analysis, Insights and Forecast - by Application
- 11. Asia Pacific Electroluminescent Display Analysis, Insights and Forecast, 2020-2032
- 11.1. Market Analysis, Insights and Forecast - by Application
- 11.1.1. Medical
- 11.1.2. Business
- 11.1.3. Defense
- 11.1.4. Transportation
- 11.1.5. Others
- 11.2. Market Analysis, Insights and Forecast - by Types
- 11.2.1. Transparent Thin Film Electroluminescent Display
- 11.2.2. Non-Transparent Thin Film Electroluminescent Display
- 11.1. Market Analysis, Insights and Forecast - by Application
- 12. Competitive Analysis
- 12.1. Company Profiles
- 12.1.1 Planar Systems
- 12.1.1.1. Company Overview
- 12.1.1.2. Products
- 12.1.1.3. Company Financials
- 12.1.1.4. SWOT Analysis
- 12.1.2 Lumineq
- 12.1.2.1. Company Overview
- 12.1.2.2. Products
- 12.1.2.3. Company Financials
- 12.1.2.4. SWOT Analysis
- 12.1.3 Sony Corporation
- 12.1.3.1. Company Overview
- 12.1.3.2. Products
- 12.1.3.3. Company Financials
- 12.1.3.4. SWOT Analysis
- 12.1.4 iFire Technology Corporation
- 12.1.4.1. Company Overview
- 12.1.4.2. Products
- 12.1.4.3. Company Financials
- 12.1.4.4. SWOT Analysis
- 12.1.5 Japan Display Inc.
- 12.1.5.1. Company Overview
- 12.1.5.2. Products
- 12.1.5.3. Company Financials
- 12.1.5.4. SWOT Analysis
- 12.1.1 Planar Systems
- 12.2. Market Entropy
- 12.2.1 Company's Key Areas Served
- 12.2.2 Recent Developments
- 12.3. Company Market Share Analysis 2025
- 12.3.1 Top 5 Companies Market Share Analysis
- 12.3.2 Top 3 Companies Market Share Analysis
- 12.4. List of Potential Customers
- 13. Research Methodology
List of Figures
- Figure 1: Global Electroluminescent Display Revenue Breakdown (billion, %) by Region 2025 & 2033
- Figure 2: North America Electroluminescent Display Revenue (billion), by Application 2025 & 2033
- Figure 3: North America Electroluminescent Display Revenue Share (%), by Application 2025 & 2033
- Figure 4: North America Electroluminescent Display Revenue (billion), by Types 2025 & 2033
- Figure 5: North America Electroluminescent Display Revenue Share (%), by Types 2025 & 2033
- Figure 6: North America Electroluminescent Display Revenue (billion), by Country 2025 & 2033
- Figure 7: North America Electroluminescent Display Revenue Share (%), by Country 2025 & 2033
- Figure 8: South America Electroluminescent Display Revenue (billion), by Application 2025 & 2033
- Figure 9: South America Electroluminescent Display Revenue Share (%), by Application 2025 & 2033
- Figure 10: South America Electroluminescent Display Revenue (billion), by Types 2025 & 2033
- Figure 11: South America Electroluminescent Display Revenue Share (%), by Types 2025 & 2033
- Figure 12: South America Electroluminescent Display Revenue (billion), by Country 2025 & 2033
- Figure 13: South America Electroluminescent Display Revenue Share (%), by Country 2025 & 2033
- Figure 14: Europe Electroluminescent Display Revenue (billion), by Application 2025 & 2033
- Figure 15: Europe Electroluminescent Display Revenue Share (%), by Application 2025 & 2033
- Figure 16: Europe Electroluminescent Display Revenue (billion), by Types 2025 & 2033
- Figure 17: Europe Electroluminescent Display Revenue Share (%), by Types 2025 & 2033
- Figure 18: Europe Electroluminescent Display Revenue (billion), by Country 2025 & 2033
- Figure 19: Europe Electroluminescent Display Revenue Share (%), by Country 2025 & 2033
- Figure 20: Middle East & Africa Electroluminescent Display Revenue (billion), by Application 2025 & 2033
- Figure 21: Middle East & Africa Electroluminescent Display Revenue Share (%), by Application 2025 & 2033
- Figure 22: Middle East & Africa Electroluminescent Display Revenue (billion), by Types 2025 & 2033
- Figure 23: Middle East & Africa Electroluminescent Display Revenue Share (%), by Types 2025 & 2033
- Figure 24: Middle East & Africa Electroluminescent Display Revenue (billion), by Country 2025 & 2033
- Figure 25: Middle East & Africa Electroluminescent Display Revenue Share (%), by Country 2025 & 2033
- Figure 26: Asia Pacific Electroluminescent Display Revenue (billion), by Application 2025 & 2033
- Figure 27: Asia Pacific Electroluminescent Display Revenue Share (%), by Application 2025 & 2033
- Figure 28: Asia Pacific Electroluminescent Display Revenue (billion), by Types 2025 & 2033
- Figure 29: Asia Pacific Electroluminescent Display Revenue Share (%), by Types 2025 & 2033
- Figure 30: Asia Pacific Electroluminescent Display Revenue (billion), by Country 2025 & 2033
- Figure 31: Asia Pacific Electroluminescent Display Revenue Share (%), by Country 2025 & 2033
List of Tables
- Table 1: Global Electroluminescent Display Revenue billion Forecast, by Application 2020 & 2033
- Table 2: Global Electroluminescent Display Revenue billion Forecast, by Types 2020 & 2033
- Table 3: Global Electroluminescent Display Revenue billion Forecast, by Region 2020 & 2033
- Table 4: Global Electroluminescent Display Revenue billion Forecast, by Application 2020 & 2033
- Table 5: Global Electroluminescent Display Revenue billion Forecast, by Types 2020 & 2033
- Table 6: Global Electroluminescent Display Revenue billion Forecast, by Country 2020 & 2033
- Table 7: United States Electroluminescent Display Revenue (billion) Forecast, by Application 2020 & 2033
- Table 8: Canada Electroluminescent Display Revenue (billion) Forecast, by Application 2020 & 2033
- Table 9: Mexico Electroluminescent Display Revenue (billion) Forecast, by Application 2020 & 2033
- Table 10: Global Electroluminescent Display Revenue billion Forecast, by Application 2020 & 2033
- Table 11: Global Electroluminescent Display Revenue billion Forecast, by Types 2020 & 2033
- Table 12: Global Electroluminescent Display Revenue billion Forecast, by Country 2020 & 2033
- Table 13: Brazil Electroluminescent Display Revenue (billion) Forecast, by Application 2020 & 2033
- Table 14: Argentina Electroluminescent Display Revenue (billion) Forecast, by Application 2020 & 2033
- Table 15: Rest of South America Electroluminescent Display Revenue (billion) Forecast, by Application 2020 & 2033
- Table 16: Global Electroluminescent Display Revenue billion Forecast, by Application 2020 & 2033
- Table 17: Global Electroluminescent Display Revenue billion Forecast, by Types 2020 & 2033
- Table 18: Global Electroluminescent Display Revenue billion Forecast, by Country 2020 & 2033
- Table 19: United Kingdom Electroluminescent Display Revenue (billion) Forecast, by Application 2020 & 2033
- Table 20: Germany Electroluminescent Display Revenue (billion) Forecast, by Application 2020 & 2033
- Table 21: France Electroluminescent Display Revenue (billion) Forecast, by Application 2020 & 2033
- Table 22: Italy Electroluminescent Display Revenue (billion) Forecast, by Application 2020 & 2033
- Table 23: Spain Electroluminescent Display Revenue (billion) Forecast, by Application 2020 & 2033
- Table 24: Russia Electroluminescent Display Revenue (billion) Forecast, by Application 2020 & 2033
- Table 25: Benelux Electroluminescent Display Revenue (billion) Forecast, by Application 2020 & 2033
- Table 26: Nordics Electroluminescent Display Revenue (billion) Forecast, by Application 2020 & 2033
- Table 27: Rest of Europe Electroluminescent Display Revenue (billion) Forecast, by Application 2020 & 2033
- Table 28: Global Electroluminescent Display Revenue billion Forecast, by Application 2020 & 2033
- Table 29: Global Electroluminescent Display Revenue billion Forecast, by Types 2020 & 2033
- Table 30: Global Electroluminescent Display Revenue billion Forecast, by Country 2020 & 2033
- Table 31: Turkey Electroluminescent Display Revenue (billion) Forecast, by Application 2020 & 2033
- Table 32: Israel Electroluminescent Display Revenue (billion) Forecast, by Application 2020 & 2033
- Table 33: GCC Electroluminescent Display Revenue (billion) Forecast, by Application 2020 & 2033
- Table 34: North Africa Electroluminescent Display Revenue (billion) Forecast, by Application 2020 & 2033
- Table 35: South Africa Electroluminescent Display Revenue (billion) Forecast, by Application 2020 & 2033
- Table 36: Rest of Middle East & Africa Electroluminescent Display Revenue (billion) Forecast, by Application 2020 & 2033
- Table 37: Global Electroluminescent Display Revenue billion Forecast, by Application 2020 & 2033
- Table 38: Global Electroluminescent Display Revenue billion Forecast, by Types 2020 & 2033
- Table 39: Global Electroluminescent Display Revenue billion Forecast, by Country 2020 & 2033
- Table 40: China Electroluminescent Display Revenue (billion) Forecast, by Application 2020 & 2033
- Table 41: India Electroluminescent Display Revenue (billion) Forecast, by Application 2020 & 2033
- Table 42: Japan Electroluminescent Display Revenue (billion) Forecast, by Application 2020 & 2033
- Table 43: South Korea Electroluminescent Display Revenue (billion) Forecast, by Application 2020 & 2033
- Table 44: ASEAN Electroluminescent Display Revenue (billion) Forecast, by Application 2020 & 2033
- Table 45: Oceania Electroluminescent Display Revenue (billion) Forecast, by Application 2020 & 2033
- Table 46: Rest of Asia Pacific Electroluminescent Display Revenue (billion) Forecast, by Application 2020 & 2033
Frequently Asked Questions
1. What is the projected Compound Annual Growth Rate (CAGR) of the Electroluminescent Display?
The projected CAGR is approximately 6.5%.
2. Which companies are prominent players in the Electroluminescent Display?
Key companies in the market include Planar Systems, Lumineq, Sony Corporation, iFire Technology Corporation, Japan Display Inc..
3. What are the main segments of the Electroluminescent Display?
The market segments include Application, Types.
4. Can you provide details about the market size?
The market size is estimated to be USD 3.4 billion as of 2022.
5. What are some drivers contributing to market growth?
N/A
6. What are the notable trends driving market growth?
N/A
7. Are there any restraints impacting market growth?
N/A
8. Can you provide examples of recent developments in the market?
N/A
9. What pricing options are available for accessing the report?
Pricing options include single-user, multi-user, and enterprise licenses priced at USD 2900.00, USD 4350.00, and USD 5800.00 respectively.
10. Is the market size provided in terms of value or volume?
The market size is provided in terms of value, measured in billion.
11. Are there any specific market keywords associated with the report?
Yes, the market keyword associated with the report is "Electroluminescent Display," which aids in identifying and referencing the specific market segment covered.
12. How do I determine which pricing option suits my needs best?
The pricing options vary based on user requirements and access needs. Individual users may opt for single-user licenses, while businesses requiring broader access may choose multi-user or enterprise licenses for cost-effective access to the report.
13. Are there any additional resources or data provided in the Electroluminescent Display report?
While the report offers comprehensive insights, it's advisable to review the specific contents or supplementary materials provided to ascertain if additional resources or data are available.
14. How can I stay updated on further developments or reports in the Electroluminescent Display?
To stay informed about further developments, trends, and reports in the Electroluminescent Display, consider subscribing to industry newsletters, following relevant companies and organizations, or regularly checking reputable industry news sources and publications.
Methodology
Step 1 - Identification of Relevant Samples Size from Population Database


Step 2 - Approaches for Defining Global Market Size (Value, Volume* & Price*)

Note*: In applicable scenarios
Step 3 - Data Sources
Primary Research
- Web Analytics
- Survey Reports
- Research Institute
- Latest Research Reports
- Opinion Leaders
Secondary Research
- Annual Reports
- White Paper
- Latest Press Release
- Industry Association
- Paid Database
- Investor Presentations

Step 4 - Data Triangulation
Involves using different sources of information in order to increase the validity of a study
These sources are likely to be stakeholders in a program - participants, other researchers, program staff, other community members, and so on.
Then we put all data in single framework & apply various statistical tools to find out the dynamic on the market.
During the analysis stage, feedback from the stakeholder groups would be compared to determine areas of agreement as well as areas of divergence