

Key Insights
The global ferrous scrap processing market is poised for robust expansion, estimated to reach a substantial market size of approximately $350 billion by 2025, with a projected Compound Annual Growth Rate (CAGR) of around 6.5% through 2033. This dynamic growth is primarily propelled by escalating demand from key end-use industries, notably the construction and automotive sectors, which are increasingly reliant on recycled steel for their manufacturing processes. The growing emphasis on sustainability and the circular economy further fuels this demand, as industries seek to reduce their environmental footprint and minimize reliance on virgin raw materials. Favorable government regulations promoting scrap recycling and the inherent cost-effectiveness of using processed ferrous scrap over primary steel production also act as significant growth drivers. The market is characterized by a diverse range of applications, with construction and automotive segments dominating, followed by tool manufacturing and other industrial uses.
The market's trajectory is also shaped by evolving trends, including advancements in sorting and processing technologies that enhance efficiency and purity of recycled ferrous scrap. The development of specialized processing techniques for different grades of ferrous metals, such as mild steel, carbon steel, stainless steel, cast iron, and wrought iron, is crucial for meeting specific industry requirements. However, the market faces certain restraints, including fluctuations in scrap availability due to economic cycles and geopolitical factors, as well as logistical challenges associated with collection and transportation. Environmental concerns related to processing emissions and the need for robust infrastructure also present hurdles. Despite these challenges, leading companies like Schnitzer Steel Products Co., Commercial Metals Co. (CMC), and David J. Joseph Co. (DJJ) are actively investing in technological innovation and strategic expansions to capitalize on the burgeoning opportunities in this vital sector. The Asia Pacific region, particularly China and India, is anticipated to witness the most significant growth due to rapid industrialization and infrastructure development.
This comprehensive report offers an in-depth analysis of the global ferrous scrap processing market, providing critical insights into its dynamics, growth trajectories, and competitive landscape. Focusing on the construction industry, automotive industry, and tool manufacturing industry as key application segments, and examining types such as mild steel, carbon steel, stainless steel, cast iron, and wrought iron, this report is essential for industry stakeholders seeking to understand and capitalize on market opportunities.
Our analysis covers the historical period (2019-2024), the base year (2025), and projects forward through a robust forecast period (2025-2033), with a key estimated year of 2025. We delve into both the parent market of metal recycling and the specialized child market of ferrous scrap processing, offering a holistic view of the value chain. With a focus on quantitative data, including market size in million units and projected CAGRs, and qualitative assessments of technological advancements, regulatory impacts, and consumer behavior, this report equips you with actionable intelligence.
Ferrous Scrap Processing Market Dynamics & Structure
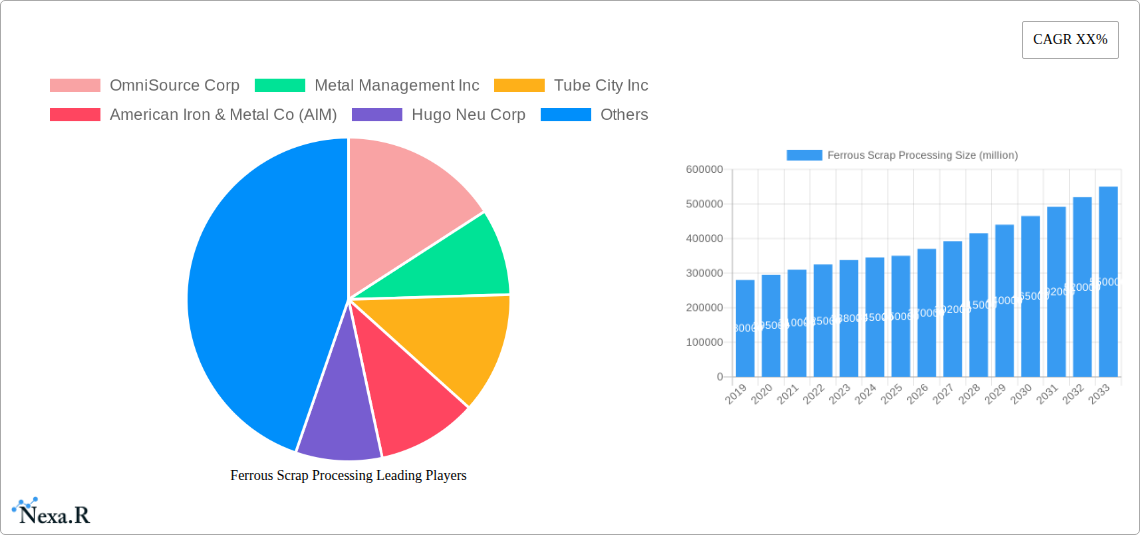
The ferrous scrap processing market exhibits a moderately concentrated structure, with key players like OmniSource Corp, Schnitzer Steel Products Co, and Commercial Metals Co. (CMC) holding significant market shares. Technological innovation is primarily driven by advancements in sorting technologies, such as eddy current separators and advanced optical sorters, improving the efficiency and purity of processed scrap. Regulatory frameworks, including environmental protection laws and waste management policies, play a crucial role in shaping operational standards and compliance costs. Competitive product substitutes, such as virgin steel production, present an ongoing challenge, though the cost-effectiveness and environmental benefits of recycled ferrous scrap continue to bolster its demand. End-user demographics are shifting towards a greater emphasis on sustainability and circular economy principles, influencing purchasing decisions. Mergers and acquisitions (M&A) are a notable trend, with companies like Metal Management Inc. and Hugo Neu Corp actively engaging in consolidation to achieve economies of scale and expand their processing capabilities.
- Market Concentration: Moderately concentrated, with a few large players dominating.
- Technological Drivers: Advanced sorting equipment, automation in shredding and baling.
- Regulatory Impact: Stringent environmental regulations influence operational practices and investment.
- Competitive Substitutes: Virgin steel production remains a key competitor, balanced by scrap's cost and sustainability advantages.
- End-User Demand: Growing preference for recycled content driven by corporate sustainability goals.
- M&A Activity: Ongoing consolidation to enhance market position and operational efficiency.
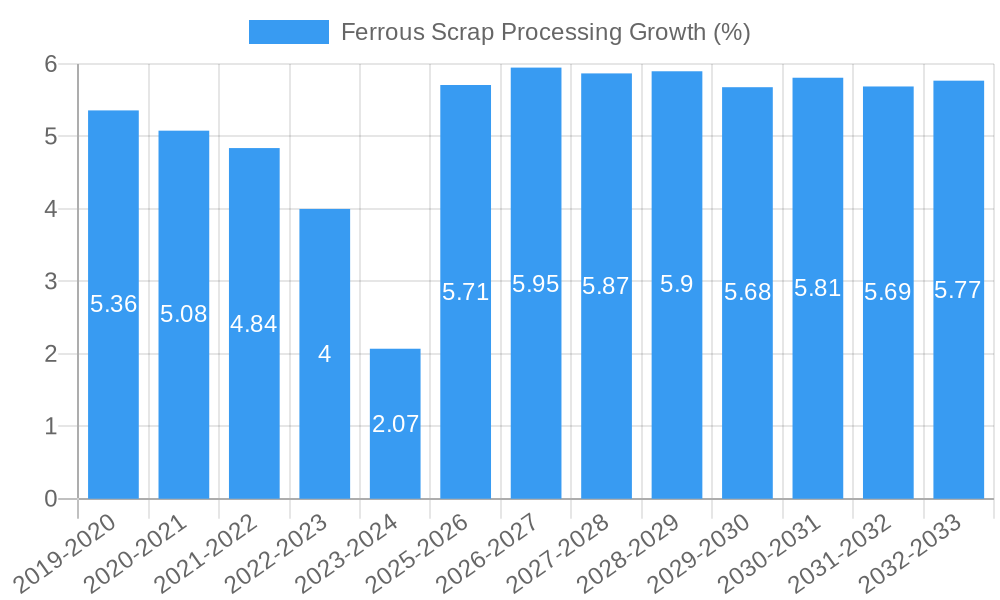
Ferrous Scrap Processing Growth Trends & Insights
The global ferrous scrap processing market is poised for substantial growth, driven by an increasing emphasis on sustainable manufacturing practices and the depletion of virgin raw materials. The market size is projected to expand significantly, fueled by robust demand from key end-use industries. Adoption rates for processed ferrous scrap are steadily increasing as businesses recognize its economic and environmental advantages. Technological disruptions, including AI-powered sorting and advanced chemical analysis of scrap grades, are enhancing processing efficiency and product quality, further stimulating market penetration. Consumer behavior shifts are evident, with a growing preference for products manufactured using recycled materials, a trend actively promoted by governments and environmental organizations. The market is expected to witness a compound annual growth rate (CAGR) of approximately 5.2% from 2025 to 2033, with market penetration reaching 78% in developed economies by the end of the forecast period. This growth is underpinned by a circular economy imperative, pushing industries to maximize resource utilization and minimize waste.
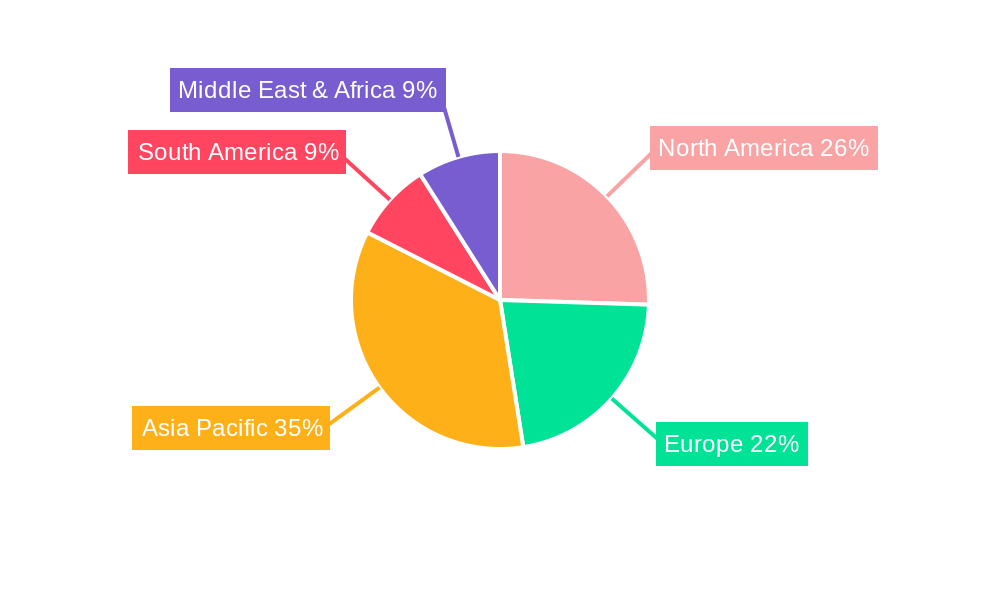
Dominant Regions, Countries, or Segments in Ferrous Scrap Processing
The Construction Industry stands as the dominant segment driving growth in the ferrous scrap processing market. This dominance is particularly pronounced in regions with high infrastructure development and urban expansion. The Automotive Industry also plays a significant role, with increasing demand for recycled steel in vehicle manufacturing, especially as manufacturers strive to meet sustainability targets and reduce their carbon footprint. Countries with well-established manufacturing bases and stringent environmental regulations, such as the United States, Germany, and China, are leading the market. For instance, the United States consistently ranks as a top producer and consumer of ferrous scrap, supported by a mature recycling infrastructure and strong domestic demand from both construction and automotive sectors.
- Dominant Application: Construction Industry, owing to extensive use in rebar, structural steel, and building components.
- Key Regional Powerhouses: North America (primarily USA), Europe (Germany), and Asia-Pacific (China).
- Driving Factors in the US: Extensive infrastructure projects, a large automotive manufacturing base, and supportive recycling policies.
- Growth Potential in Asia-Pacific: Rapid industrialization and urbanization in countries like China and India are creating substantial demand for ferrous scrap.
- Technological Adoption: Leading regions are at the forefront of adopting advanced sorting and processing technologies to enhance scrap quality and value.
- Market Share Contribution: The construction segment is estimated to account for approximately 45% of the total ferrous scrap processing market share.
- Emerging Markets: Developing economies in Southeast Asia and Latin America present significant untapped potential for growth.
Ferrous Scrap Processing Product Landscape
The ferrous scrap processing industry offers a diverse range of processed materials, meticulously categorized by grade and composition to meet specific industrial needs. Mild steel and carbon steel are the most prevalent types, extensively utilized in the construction and automotive sectors for their versatility and cost-effectiveness. Stainless steel scrap finds application in high-end manufacturing and specialized engineering due to its corrosion resistance. Processed cast iron is crucial for foundries producing engine blocks and heavy machinery components, while wrought iron, though less common, serves niche markets requiring specific malleability. Innovations focus on enhancing the purity of these grades through advanced sorting techniques, ensuring that processed scrap meets stringent metallurgical specifications and reduces reliance on virgin materials, thereby offering superior performance and sustainability.
Key Drivers, Barriers & Challenges in Ferrous Scrap Processing
Key Drivers:
- Environmental Regulations: Increasing global focus on sustainability and circular economy principles, driving demand for recycled materials.
- Cost-Effectiveness: Ferrous scrap processing offers a more economical alternative to virgin steel production.
- Infrastructure Development: Global expansion in construction projects directly boosts demand for steel and thus ferrous scrap.
- Technological Advancements: Improved sorting and processing technologies enhance scrap quality and efficiency.
- Automotive Industry Demand: Growing shift towards sustainable manufacturing in the automotive sector.
Barriers & Challenges:
- Supply Chain Volatility: Fluctuations in the availability and price of scrap metal can impact production.
- Quality Consistency: Ensuring consistent quality and purity of processed scrap remains a challenge, impacting its suitability for high-grade applications.
- Regulatory Compliance Costs: Adhering to evolving environmental and safety regulations can incur significant operational expenses.
- Global Competition: Intense competition from both domestic and international processors.
- Contamination Issues: Presence of non-ferrous metals and other contaminants can reduce the value and usability of ferrous scrap.
Emerging Opportunities in Ferrous Scrap Processing
Emerging opportunities lie in the development of advanced processing techniques for specialized ferrous scrap grades, such as high-alloy steels. Untapped markets in developing economies with burgeoning industrial sectors present significant growth potential. Furthermore, the increasing consumer demand for "green" products is creating a niche for manufacturers who can demonstrably utilize high percentages of recycled ferrous content. The integration of AI and IoT in scrap identification and sorting promises to unlock greater value from mixed scrap streams, presenting a significant opportunity for forward-thinking processors.
Growth Accelerators in the Ferrous Scrap Processing Industry
The long-term growth of the ferrous scrap processing industry is being accelerated by several key catalysts. Technological breakthroughs in automated sorting, including optical recognition and magnetic separation, are enhancing efficiency and purity, making recycled ferrous materials more competitive. Strategic partnerships between scrap processors and steel manufacturers are fostering closer collaboration and ensuring a stable supply chain for high-quality recycled content. Market expansion strategies, particularly in regions with developing industrial bases, are opening new avenues for growth. Furthermore, government initiatives promoting circular economy principles and incentivizing the use of recycled materials are providing a strong impetus for industry expansion.
Key Players Shaping the Ferrous Scrap Processing Market
- OmniSource Corp
- Metal Management Inc
- Tube City Inc
- American Iron & Metal Co (AIM)
- Hugo Neu Corp
- Ferrous Processing & Trading Co. (FTP)
- WIDE REACH
- Schnitzer Steel Products Co
- PSC Metals
- David J. Joseph Co. (DJJ)
- AMG Resources Corp
- Commercial Metals Co. (CMC)
- Miller Compressing Co
- Cohen Brothers Inc
Notable Milestones in Ferrous Scrap Processing Sector
- 2019: Introduction of advanced eddy current separators for enhanced non-ferrous metal removal.
- 2020: Increased regulatory focus on waste-to-resource policies globally.
- 2021: Significant investments in automated sorting technologies by major players like Schnitzer Steel.
- 2022: Growing demand for processed scrap from electric vehicle (EV) battery recycling initiatives.
- 2023: Expansion of processing facilities in emerging markets to cater to industrial growth.
- 2024: Development of AI-powered visual inspection systems for precise scrap grading.
In-Depth Ferrous Scrap Processing Market Outlook
The ferrous scrap processing market is projected for continued robust growth, driven by an unwavering global commitment to sustainability and the circular economy. Key growth accelerators include ongoing technological innovations in sorting and material characterization, enabling higher purity and wider application of recycled ferrous materials. Strategic alliances between processors, steelmakers, and end-users will further solidify supply chains and foster innovation. Market expansion into regions with developing industrial footprints, coupled with supportive government policies that incentivize recycling and the use of recycled content, will fuel long-term expansion. The industry is well-positioned to benefit from increasing demand across the construction, automotive, and manufacturing sectors, solidifying its role as a vital component of a sustainable industrial future.
Ferrous Scrap Processing Segmentation
-
1. Application
- 1.1. Construction Industry
- 1.2. Automotive Industry
- 1.3. Tool Manufacturing Industry
- 1.4. Other
-
2. Types
- 2.1. Mild Steel
- 2.2. Carbon Steel
- 2.3. Stainless Steel
- 2.4. Cast Iron
- 2.5. Wrought Iron
Ferrous Scrap Processing Segmentation By Geography
-
1. North America
- 1.1. United States
- 1.2. Canada
- 1.3. Mexico
-
2. South America
- 2.1. Brazil
- 2.2. Argentina
- 2.3. Rest of South America
-
3. Europe
- 3.1. United Kingdom
- 3.2. Germany
- 3.3. France
- 3.4. Italy
- 3.5. Spain
- 3.6. Russia
- 3.7. Benelux
- 3.8. Nordics
- 3.9. Rest of Europe
-
4. Middle East & Africa
- 4.1. Turkey
- 4.2. Israel
- 4.3. GCC
- 4.4. North Africa
- 4.5. South Africa
- 4.6. Rest of Middle East & Africa
-
5. Asia Pacific
- 5.1. China
- 5.2. India
- 5.3. Japan
- 5.4. South Korea
- 5.5. ASEAN
- 5.6. Oceania
- 5.7. Rest of Asia Pacific
Ferrous Scrap Processing REPORT HIGHLIGHTS
| Aspects | Details |
|---|---|
| Study Period | 2019-2033 |
| Base Year | 2024 |
| Estimated Year | 2025 |
| Forecast Period | 2025-2033 |
| Historical Period | 2019-2024 |
| Growth Rate | CAGR of XX% from 2019-2033 |
| Segmentation |
|
Table of Contents
- 1. Introduction
- 1.1. Research Scope
- 1.2. Market Segmentation
- 1.3. Research Methodology
- 1.4. Definitions and Assumptions
- 2. Executive Summary
- 2.1. Introduction
- 3. Market Dynamics
- 3.1. Introduction
- 3.2. Market Drivers
- 3.3. Market Restrains
- 3.4. Market Trends
- 4. Market Factor Analysis
- 4.1. Porters Five Forces
- 4.2. Supply/Value Chain
- 4.3. PESTEL analysis
- 4.4. Market Entropy
- 4.5. Patent/Trademark Analysis
- 5. Global Ferrous Scrap Processing Analysis, Insights and Forecast, 2019-2031
- 5.1. Market Analysis, Insights and Forecast - by Application
- 5.1.1. Construction Industry
- 5.1.2. Automotive Industry
- 5.1.3. Tool Manufacturing Industry
- 5.1.4. Other
- 5.2. Market Analysis, Insights and Forecast - by Types
- 5.2.1. Mild Steel
- 5.2.2. Carbon Steel
- 5.2.3. Stainless Steel
- 5.2.4. Cast Iron
- 5.2.5. Wrought Iron
- 5.3. Market Analysis, Insights and Forecast - by Region
- 5.3.1. North America
- 5.3.2. South America
- 5.3.3. Europe
- 5.3.4. Middle East & Africa
- 5.3.5. Asia Pacific
- 5.1. Market Analysis, Insights and Forecast - by Application
- 6. North America Ferrous Scrap Processing Analysis, Insights and Forecast, 2019-2031
- 6.1. Market Analysis, Insights and Forecast - by Application
- 6.1.1. Construction Industry
- 6.1.2. Automotive Industry
- 6.1.3. Tool Manufacturing Industry
- 6.1.4. Other
- 6.2. Market Analysis, Insights and Forecast - by Types
- 6.2.1. Mild Steel
- 6.2.2. Carbon Steel
- 6.2.3. Stainless Steel
- 6.2.4. Cast Iron
- 6.2.5. Wrought Iron
- 6.1. Market Analysis, Insights and Forecast - by Application
- 7. South America Ferrous Scrap Processing Analysis, Insights and Forecast, 2019-2031
- 7.1. Market Analysis, Insights and Forecast - by Application
- 7.1.1. Construction Industry
- 7.1.2. Automotive Industry
- 7.1.3. Tool Manufacturing Industry
- 7.1.4. Other
- 7.2. Market Analysis, Insights and Forecast - by Types
- 7.2.1. Mild Steel
- 7.2.2. Carbon Steel
- 7.2.3. Stainless Steel
- 7.2.4. Cast Iron
- 7.2.5. Wrought Iron
- 7.1. Market Analysis, Insights and Forecast - by Application
- 8. Europe Ferrous Scrap Processing Analysis, Insights and Forecast, 2019-2031
- 8.1. Market Analysis, Insights and Forecast - by Application
- 8.1.1. Construction Industry
- 8.1.2. Automotive Industry
- 8.1.3. Tool Manufacturing Industry
- 8.1.4. Other
- 8.2. Market Analysis, Insights and Forecast - by Types
- 8.2.1. Mild Steel
- 8.2.2. Carbon Steel
- 8.2.3. Stainless Steel
- 8.2.4. Cast Iron
- 8.2.5. Wrought Iron
- 8.1. Market Analysis, Insights and Forecast - by Application
- 9. Middle East & Africa Ferrous Scrap Processing Analysis, Insights and Forecast, 2019-2031
- 9.1. Market Analysis, Insights and Forecast - by Application
- 9.1.1. Construction Industry
- 9.1.2. Automotive Industry
- 9.1.3. Tool Manufacturing Industry
- 9.1.4. Other
- 9.2. Market Analysis, Insights and Forecast - by Types
- 9.2.1. Mild Steel
- 9.2.2. Carbon Steel
- 9.2.3. Stainless Steel
- 9.2.4. Cast Iron
- 9.2.5. Wrought Iron
- 9.1. Market Analysis, Insights and Forecast - by Application
- 10. Asia Pacific Ferrous Scrap Processing Analysis, Insights and Forecast, 2019-2031
- 10.1. Market Analysis, Insights and Forecast - by Application
- 10.1.1. Construction Industry
- 10.1.2. Automotive Industry
- 10.1.3. Tool Manufacturing Industry
- 10.1.4. Other
- 10.2. Market Analysis, Insights and Forecast - by Types
- 10.2.1. Mild Steel
- 10.2.2. Carbon Steel
- 10.2.3. Stainless Steel
- 10.2.4. Cast Iron
- 10.2.5. Wrought Iron
- 10.1. Market Analysis, Insights and Forecast - by Application
- 11. Competitive Analysis
- 11.1. Global Market Share Analysis 2024
- 11.2. Company Profiles
- 11.2.1 OmniSource Corp
- 11.2.1.1. Overview
- 11.2.1.2. Products
- 11.2.1.3. SWOT Analysis
- 11.2.1.4. Recent Developments
- 11.2.1.5. Financials (Based on Availability)
- 11.2.2 Metal Management Inc
- 11.2.2.1. Overview
- 11.2.2.2. Products
- 11.2.2.3. SWOT Analysis
- 11.2.2.4. Recent Developments
- 11.2.2.5. Financials (Based on Availability)
- 11.2.3 Tube City Inc
- 11.2.3.1. Overview
- 11.2.3.2. Products
- 11.2.3.3. SWOT Analysis
- 11.2.3.4. Recent Developments
- 11.2.3.5. Financials (Based on Availability)
- 11.2.4 American Iron & Metal Co (AIM)
- 11.2.4.1. Overview
- 11.2.4.2. Products
- 11.2.4.3. SWOT Analysis
- 11.2.4.4. Recent Developments
- 11.2.4.5. Financials (Based on Availability)
- 11.2.5 Hugo Neu Corp
- 11.2.5.1. Overview
- 11.2.5.2. Products
- 11.2.5.3. SWOT Analysis
- 11.2.5.4. Recent Developments
- 11.2.5.5. Financials (Based on Availability)
- 11.2.6 Ferrous Processing & Trading Co. (FTP)
- 11.2.6.1. Overview
- 11.2.6.2. Products
- 11.2.6.3. SWOT Analysis
- 11.2.6.4. Recent Developments
- 11.2.6.5. Financials (Based on Availability)
- 11.2.7 WIDE REACH
- 11.2.7.1. Overview
- 11.2.7.2. Products
- 11.2.7.3. SWOT Analysis
- 11.2.7.4. Recent Developments
- 11.2.7.5. Financials (Based on Availability)
- 11.2.8 Schnitzer Steel Products Co
- 11.2.8.1. Overview
- 11.2.8.2. Products
- 11.2.8.3. SWOT Analysis
- 11.2.8.4. Recent Developments
- 11.2.8.5. Financials (Based on Availability)
- 11.2.9 PSC Metals
- 11.2.9.1. Overview
- 11.2.9.2. Products
- 11.2.9.3. SWOT Analysis
- 11.2.9.4. Recent Developments
- 11.2.9.5. Financials (Based on Availability)
- 11.2.10 David J. Joseph Co. (DJJ)
- 11.2.10.1. Overview
- 11.2.10.2. Products
- 11.2.10.3. SWOT Analysis
- 11.2.10.4. Recent Developments
- 11.2.10.5. Financials (Based on Availability)
- 11.2.11 AMG Resources Corp
- 11.2.11.1. Overview
- 11.2.11.2. Products
- 11.2.11.3. SWOT Analysis
- 11.2.11.4. Recent Developments
- 11.2.11.5. Financials (Based on Availability)
- 11.2.12 Commercial Metals Co. (CMC)
- 11.2.12.1. Overview
- 11.2.12.2. Products
- 11.2.12.3. SWOT Analysis
- 11.2.12.4. Recent Developments
- 11.2.12.5. Financials (Based on Availability)
- 11.2.13 Regional powers.
- 11.2.13.1. Overview
- 11.2.13.2. Products
- 11.2.13.3. SWOT Analysis
- 11.2.13.4. Recent Developments
- 11.2.13.5. Financials (Based on Availability)
- 11.2.14 Miller Compressing Co
- 11.2.14.1. Overview
- 11.2.14.2. Products
- 11.2.14.3. SWOT Analysis
- 11.2.14.4. Recent Developments
- 11.2.14.5. Financials (Based on Availability)
- 11.2.15 Cohen Brothers Inc
- 11.2.15.1. Overview
- 11.2.15.2. Products
- 11.2.15.3. SWOT Analysis
- 11.2.15.4. Recent Developments
- 11.2.15.5. Financials (Based on Availability)
- 11.2.1 OmniSource Corp
List of Figures
- Figure 1: Global Ferrous Scrap Processing Revenue Breakdown (million, %) by Region 2024 & 2032
- Figure 2: North America Ferrous Scrap Processing Revenue (million), by Application 2024 & 2032
- Figure 3: North America Ferrous Scrap Processing Revenue Share (%), by Application 2024 & 2032
- Figure 4: North America Ferrous Scrap Processing Revenue (million), by Types 2024 & 2032
- Figure 5: North America Ferrous Scrap Processing Revenue Share (%), by Types 2024 & 2032
- Figure 6: North America Ferrous Scrap Processing Revenue (million), by Country 2024 & 2032
- Figure 7: North America Ferrous Scrap Processing Revenue Share (%), by Country 2024 & 2032
- Figure 8: South America Ferrous Scrap Processing Revenue (million), by Application 2024 & 2032
- Figure 9: South America Ferrous Scrap Processing Revenue Share (%), by Application 2024 & 2032
- Figure 10: South America Ferrous Scrap Processing Revenue (million), by Types 2024 & 2032
- Figure 11: South America Ferrous Scrap Processing Revenue Share (%), by Types 2024 & 2032
- Figure 12: South America Ferrous Scrap Processing Revenue (million), by Country 2024 & 2032
- Figure 13: South America Ferrous Scrap Processing Revenue Share (%), by Country 2024 & 2032
- Figure 14: Europe Ferrous Scrap Processing Revenue (million), by Application 2024 & 2032
- Figure 15: Europe Ferrous Scrap Processing Revenue Share (%), by Application 2024 & 2032
- Figure 16: Europe Ferrous Scrap Processing Revenue (million), by Types 2024 & 2032
- Figure 17: Europe Ferrous Scrap Processing Revenue Share (%), by Types 2024 & 2032
- Figure 18: Europe Ferrous Scrap Processing Revenue (million), by Country 2024 & 2032
- Figure 19: Europe Ferrous Scrap Processing Revenue Share (%), by Country 2024 & 2032
- Figure 20: Middle East & Africa Ferrous Scrap Processing Revenue (million), by Application 2024 & 2032
- Figure 21: Middle East & Africa Ferrous Scrap Processing Revenue Share (%), by Application 2024 & 2032
- Figure 22: Middle East & Africa Ferrous Scrap Processing Revenue (million), by Types 2024 & 2032
- Figure 23: Middle East & Africa Ferrous Scrap Processing Revenue Share (%), by Types 2024 & 2032
- Figure 24: Middle East & Africa Ferrous Scrap Processing Revenue (million), by Country 2024 & 2032
- Figure 25: Middle East & Africa Ferrous Scrap Processing Revenue Share (%), by Country 2024 & 2032
- Figure 26: Asia Pacific Ferrous Scrap Processing Revenue (million), by Application 2024 & 2032
- Figure 27: Asia Pacific Ferrous Scrap Processing Revenue Share (%), by Application 2024 & 2032
- Figure 28: Asia Pacific Ferrous Scrap Processing Revenue (million), by Types 2024 & 2032
- Figure 29: Asia Pacific Ferrous Scrap Processing Revenue Share (%), by Types 2024 & 2032
- Figure 30: Asia Pacific Ferrous Scrap Processing Revenue (million), by Country 2024 & 2032
- Figure 31: Asia Pacific Ferrous Scrap Processing Revenue Share (%), by Country 2024 & 2032
List of Tables
- Table 1: Global Ferrous Scrap Processing Revenue million Forecast, by Region 2019 & 2032
- Table 2: Global Ferrous Scrap Processing Revenue million Forecast, by Application 2019 & 2032
- Table 3: Global Ferrous Scrap Processing Revenue million Forecast, by Types 2019 & 2032
- Table 4: Global Ferrous Scrap Processing Revenue million Forecast, by Region 2019 & 2032
- Table 5: Global Ferrous Scrap Processing Revenue million Forecast, by Application 2019 & 2032
- Table 6: Global Ferrous Scrap Processing Revenue million Forecast, by Types 2019 & 2032
- Table 7: Global Ferrous Scrap Processing Revenue million Forecast, by Country 2019 & 2032
- Table 8: United States Ferrous Scrap Processing Revenue (million) Forecast, by Application 2019 & 2032
- Table 9: Canada Ferrous Scrap Processing Revenue (million) Forecast, by Application 2019 & 2032
- Table 10: Mexico Ferrous Scrap Processing Revenue (million) Forecast, by Application 2019 & 2032
- Table 11: Global Ferrous Scrap Processing Revenue million Forecast, by Application 2019 & 2032
- Table 12: Global Ferrous Scrap Processing Revenue million Forecast, by Types 2019 & 2032
- Table 13: Global Ferrous Scrap Processing Revenue million Forecast, by Country 2019 & 2032
- Table 14: Brazil Ferrous Scrap Processing Revenue (million) Forecast, by Application 2019 & 2032
- Table 15: Argentina Ferrous Scrap Processing Revenue (million) Forecast, by Application 2019 & 2032
- Table 16: Rest of South America Ferrous Scrap Processing Revenue (million) Forecast, by Application 2019 & 2032
- Table 17: Global Ferrous Scrap Processing Revenue million Forecast, by Application 2019 & 2032
- Table 18: Global Ferrous Scrap Processing Revenue million Forecast, by Types 2019 & 2032
- Table 19: Global Ferrous Scrap Processing Revenue million Forecast, by Country 2019 & 2032
- Table 20: United Kingdom Ferrous Scrap Processing Revenue (million) Forecast, by Application 2019 & 2032
- Table 21: Germany Ferrous Scrap Processing Revenue (million) Forecast, by Application 2019 & 2032
- Table 22: France Ferrous Scrap Processing Revenue (million) Forecast, by Application 2019 & 2032
- Table 23: Italy Ferrous Scrap Processing Revenue (million) Forecast, by Application 2019 & 2032
- Table 24: Spain Ferrous Scrap Processing Revenue (million) Forecast, by Application 2019 & 2032
- Table 25: Russia Ferrous Scrap Processing Revenue (million) Forecast, by Application 2019 & 2032
- Table 26: Benelux Ferrous Scrap Processing Revenue (million) Forecast, by Application 2019 & 2032
- Table 27: Nordics Ferrous Scrap Processing Revenue (million) Forecast, by Application 2019 & 2032
- Table 28: Rest of Europe Ferrous Scrap Processing Revenue (million) Forecast, by Application 2019 & 2032
- Table 29: Global Ferrous Scrap Processing Revenue million Forecast, by Application 2019 & 2032
- Table 30: Global Ferrous Scrap Processing Revenue million Forecast, by Types 2019 & 2032
- Table 31: Global Ferrous Scrap Processing Revenue million Forecast, by Country 2019 & 2032
- Table 32: Turkey Ferrous Scrap Processing Revenue (million) Forecast, by Application 2019 & 2032
- Table 33: Israel Ferrous Scrap Processing Revenue (million) Forecast, by Application 2019 & 2032
- Table 34: GCC Ferrous Scrap Processing Revenue (million) Forecast, by Application 2019 & 2032
- Table 35: North Africa Ferrous Scrap Processing Revenue (million) Forecast, by Application 2019 & 2032
- Table 36: South Africa Ferrous Scrap Processing Revenue (million) Forecast, by Application 2019 & 2032
- Table 37: Rest of Middle East & Africa Ferrous Scrap Processing Revenue (million) Forecast, by Application 2019 & 2032
- Table 38: Global Ferrous Scrap Processing Revenue million Forecast, by Application 2019 & 2032
- Table 39: Global Ferrous Scrap Processing Revenue million Forecast, by Types 2019 & 2032
- Table 40: Global Ferrous Scrap Processing Revenue million Forecast, by Country 2019 & 2032
- Table 41: China Ferrous Scrap Processing Revenue (million) Forecast, by Application 2019 & 2032
- Table 42: India Ferrous Scrap Processing Revenue (million) Forecast, by Application 2019 & 2032
- Table 43: Japan Ferrous Scrap Processing Revenue (million) Forecast, by Application 2019 & 2032
- Table 44: South Korea Ferrous Scrap Processing Revenue (million) Forecast, by Application 2019 & 2032
- Table 45: ASEAN Ferrous Scrap Processing Revenue (million) Forecast, by Application 2019 & 2032
- Table 46: Oceania Ferrous Scrap Processing Revenue (million) Forecast, by Application 2019 & 2032
- Table 47: Rest of Asia Pacific Ferrous Scrap Processing Revenue (million) Forecast, by Application 2019 & 2032
Frequently Asked Questions
1. What is the projected Compound Annual Growth Rate (CAGR) of the Ferrous Scrap Processing?
The projected CAGR is approximately XX%.
2. Which companies are prominent players in the Ferrous Scrap Processing?
Key companies in the market include OmniSource Corp, Metal Management Inc, Tube City Inc, American Iron & Metal Co (AIM), Hugo Neu Corp, Ferrous Processing & Trading Co. (FTP), WIDE REACH, Schnitzer Steel Products Co, PSC Metals, David J. Joseph Co. (DJJ), AMG Resources Corp, Commercial Metals Co. (CMC), Regional powers., Miller Compressing Co, Cohen Brothers Inc.
3. What are the main segments of the Ferrous Scrap Processing?
The market segments include Application, Types.
4. Can you provide details about the market size?
The market size is estimated to be USD XXX million as of 2022.
5. What are some drivers contributing to market growth?
N/A
6. What are the notable trends driving market growth?
N/A
7. Are there any restraints impacting market growth?
N/A
8. Can you provide examples of recent developments in the market?
N/A
9. What pricing options are available for accessing the report?
Pricing options include single-user, multi-user, and enterprise licenses priced at USD 4900.00, USD 7350.00, and USD 9800.00 respectively.
10. Is the market size provided in terms of value or volume?
The market size is provided in terms of value, measured in million.
11. Are there any specific market keywords associated with the report?
Yes, the market keyword associated with the report is "Ferrous Scrap Processing," which aids in identifying and referencing the specific market segment covered.
12. How do I determine which pricing option suits my needs best?
The pricing options vary based on user requirements and access needs. Individual users may opt for single-user licenses, while businesses requiring broader access may choose multi-user or enterprise licenses for cost-effective access to the report.
13. Are there any additional resources or data provided in the Ferrous Scrap Processing report?
While the report offers comprehensive insights, it's advisable to review the specific contents or supplementary materials provided to ascertain if additional resources or data are available.
14. How can I stay updated on further developments or reports in the Ferrous Scrap Processing?
To stay informed about further developments, trends, and reports in the Ferrous Scrap Processing, consider subscribing to industry newsletters, following relevant companies and organizations, or regularly checking reputable industry news sources and publications.
Methodology
Step 1 - Identification of Relevant Samples Size from Population Database


Step 2 - Approaches for Defining Global Market Size (Value, Volume* & Price*)

Note*: In applicable scenarios
Step 3 - Data Sources
Primary Research
- Web Analytics
- Survey Reports
- Research Institute
- Latest Research Reports
- Opinion Leaders
Secondary Research
- Annual Reports
- White Paper
- Latest Press Release
- Industry Association
- Paid Database
- Investor Presentations

Step 4 - Data Triangulation
Involves using different sources of information in order to increase the validity of a study
These sources are likely to be stakeholders in a program - participants, other researchers, program staff, other community members, and so on.
Then we put all data in single framework & apply various statistical tools to find out the dynamic on the market.
During the analysis stage, feedback from the stakeholder groups would be compared to determine areas of agreement as well as areas of divergence
