

Key Insights
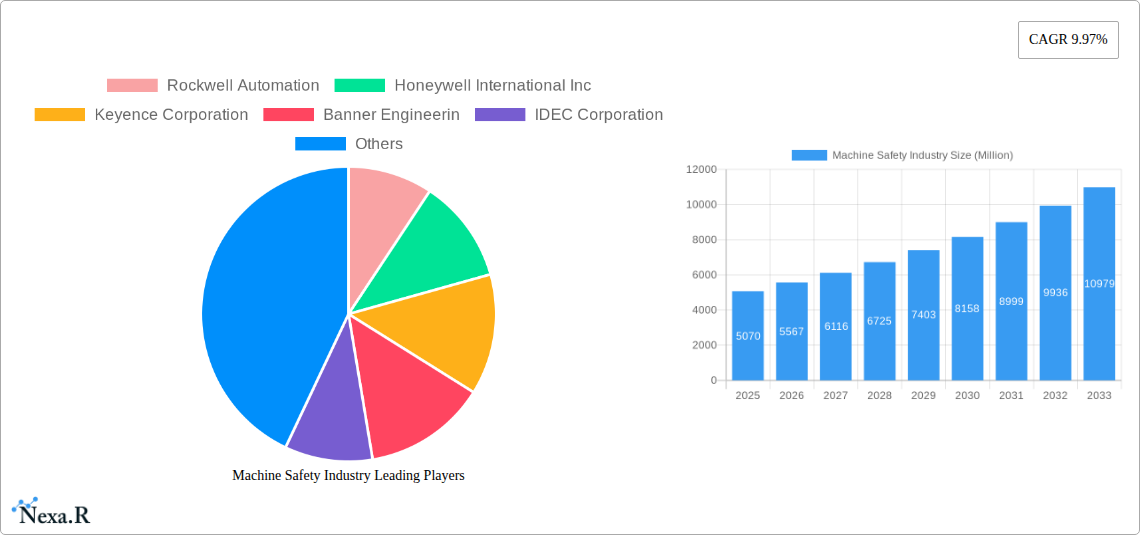
The global machine safety market, valued at $5.07 billion in 2025, is projected to experience robust growth, driven by increasing automation across various industries and stringent safety regulations. The Compound Annual Growth Rate (CAGR) of 9.97% from 2025 to 2033 indicates a significant expansion, primarily fueled by rising demand for advanced safety solutions in sectors like automotive, electronics, and healthcare. The integration of smart sensors, IoT connectivity, and predictive maintenance technologies are key trends shaping the market. Growth is further propelled by the increasing adoption of Industry 4.0 principles and the need to prevent workplace accidents, minimize downtime, and improve overall productivity. While initial investment costs for implementing machine safety systems can be a restraint, the long-term benefits in terms of reduced liability, improved worker safety, and enhanced operational efficiency outweigh the initial expenses, driving market adoption. The market is segmented by implementation (individual vs. embedded components) and component type (presence sensing safety sensors, emergency stop devices, safety interlock switches, safety controllers/modules/relays, and other components). End-user segments include electronics and semiconductors, oil and gas, healthcare, food and beverage, and automotive industries, each contributing significantly to market growth.
The competitive landscape is characterized by several established players such as Rockwell Automation, Honeywell, Keyence, and Siemens, along with other significant regional and specialized companies. These companies are continuously innovating to offer sophisticated and integrated machine safety solutions. Geographic distribution reveals a strong presence across North America, Europe, and Asia Pacific, with Asia Pacific exhibiting particularly strong growth potential due to rapid industrialization and increasing automation investment. Future growth will likely be influenced by technological advancements, evolving regulatory landscapes, and the expanding adoption of machine safety standards across diverse industrial sectors. Furthermore, the increasing focus on cybersecurity for industrial automation systems will further drive the demand for advanced and integrated safety solutions.
Machine Safety Industry Market Report: 2019-2033
This comprehensive report provides an in-depth analysis of the Machine Safety Industry, encompassing market dynamics, growth trends, regional segmentation, product landscape, key players, and future outlook. The report covers the period 2019-2033, with a focus on the forecast period 2025-2033 and a base year of 2025. This detailed analysis is invaluable for industry professionals, investors, and strategic decision-makers seeking to navigate this crucial sector. The market is segmented by implementation (Individual Components, Embedded Components), component (Presence Sensing Safety Sensors, Emergency Stop Devices, Safety Interlock Switches, Safety Controller/Modules/Relays, Other Components), and end-user (Electronics and Semiconductors, Oil and Gas, Healthcare, Food and Beverage, Automotive, Other End-Users).
Machine Safety Industry Market Dynamics & Structure
The global machine safety market, valued at xx Million in 2024, is characterized by a moderately consolidated structure with key players like Rockwell Automation, Honeywell International Inc, and Siemens AG holding significant market share. Technological innovation, particularly in sensor technology and AI-driven safety systems, is a key driver. Stringent safety regulations across various industries, especially in automotive and manufacturing, are further propelling market growth. However, high initial investment costs and integration complexities pose challenges. Competitive substitution from cost-effective solutions and the evolving landscape of Industry 4.0 present both opportunities and threats. Mergers and acquisitions are frequent, indicating consolidation efforts within the market.
- Market Concentration: Moderately consolidated, with top 5 players holding approximately xx% market share.
- Technological Innovation: Focus on AI-powered safety systems, advanced sensors, and predictive maintenance.
- Regulatory Framework: Stringent safety standards (e.g., ISO 13849, IEC 62061) driving adoption.
- Competitive Substitutes: Cost-effective alternatives and emerging technologies creating competitive pressure.
- End-User Demographics: Manufacturing, automotive, and food & beverage are major end-users.
- M&A Trends: Consolidation through acquisitions and strategic partnerships to expand market reach and technological capabilities. Approximately xx M&A deals occurred between 2019-2024.
Machine Safety Industry Growth Trends & Insights
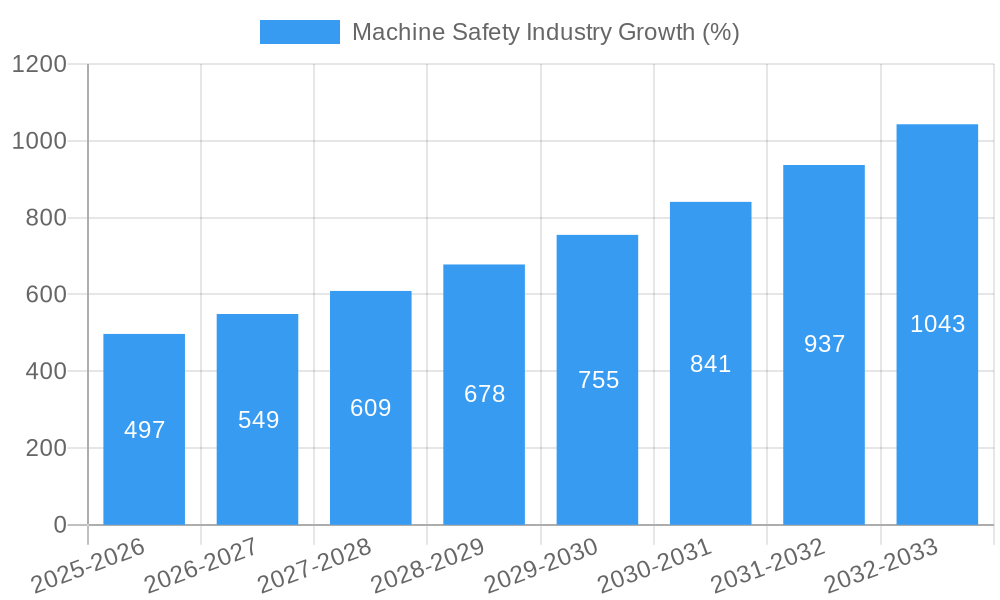
The machine safety market is experiencing robust growth, driven by increasing automation across industries and stringent safety regulations. The historical period (2019-2024) witnessed a CAGR of xx%, and this momentum is expected to continue, with a projected CAGR of xx% during the forecast period (2025-2033), reaching a market value of xx Million by 2033. This growth is fueled by technological advancements, rising adoption rates in emerging economies, and a growing awareness of workplace safety. The market penetration rate is expected to increase from xx% in 2024 to xx% by 2033. Technological disruptions, such as the integration of IoT and AI, are transforming the industry, leading to more sophisticated and proactive safety systems. Consumer behavior shifts towards greater emphasis on safety and productivity are also significantly impacting market demand.
Dominant Regions, Countries, or Segments in Machine Safety Industry
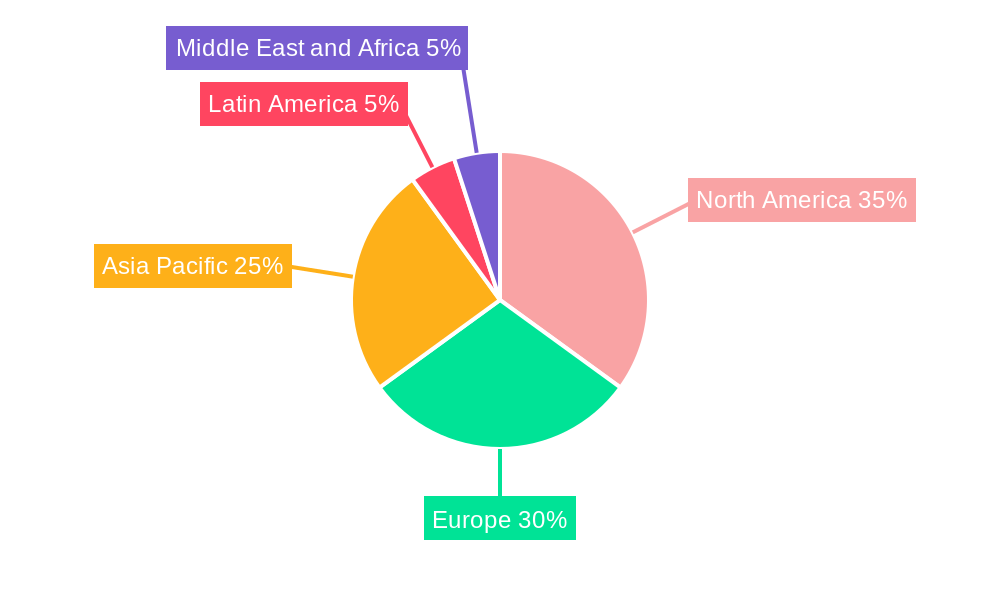
North America currently holds the largest market share, driven by strong industrial automation and stringent safety regulations. However, Asia-Pacific is projected to witness the highest growth rate during the forecast period, fueled by rapid industrialization and expanding manufacturing sectors in countries like China and India. Within the segment breakdown, the Presence Sensing Safety Sensors segment commands a substantial share due to its critical role in preventing accidents. The Automotive end-user segment also shows significant growth potential, driven by the increasing automation and safety features in vehicles.
- North America: High adoption rate due to established industrial base and stringent regulations.
- Europe: Strong demand driven by robust manufacturing sector and focus on worker safety.
- Asia-Pacific: Fastest-growing region due to rapid industrialization and increasing automation.
- Presence Sensing Safety Sensors: Largest component segment due to critical role in accident prevention.
- Automotive: Largest end-user segment, driven by increasing vehicle automation and safety standards.
Machine Safety Industry Product Landscape
The machine safety industry offers a wide array of products, from basic safety switches to sophisticated integrated safety systems. Recent innovations include smart sensors with advanced diagnostics, AI-powered safety controllers that can predict potential hazards, and collaborative robots with inherent safety features. These advancements improve overall safety, reduce downtime, and enhance productivity. Unique selling propositions include ease of integration, advanced diagnostics, and predictive maintenance capabilities.
Key Drivers, Barriers & Challenges in Machine Safety Industry
Key Drivers:
- Increasing automation across various industries.
- Stringent safety regulations and standards.
- Growing awareness of workplace safety and risk mitigation.
- Technological advancements in sensor technology and AI.
Key Challenges:
- High initial investment costs for implementing safety systems.
- Complexity in integrating safety systems into existing infrastructure.
- Supply chain disruptions impacting component availability and costs.
- Competition from cost-effective, but potentially less safe alternatives. This has resulted in a xx% reduction in profit margins for some key players over the past year.
Emerging Opportunities in Machine Safety Industry
- Growing demand for safety solutions in emerging markets.
- Development of advanced safety systems for collaborative robots.
- Integration of AI and IoT for predictive maintenance and proactive safety measures.
- Increasing adoption of safety systems in non-traditional industries.
Growth Accelerators in the Machine Safety Industry
Technological breakthroughs in sensor technology, AI, and machine learning are accelerating growth. Strategic partnerships between safety equipment manufacturers and automation companies are creating integrated solutions. Expansion into new and emerging markets with rising industrialization is driving significant market growth.
Key Players Shaping the Machine Safety Industry Market
- Rockwell Automation
- Honeywell International Inc
- Keyence Corporation
- Banner Engineering
- IDEC Corporation
- Mitsubishi Electric Corporation
- Siemens AG
- Schneider Electric SE
- Omron Corporation
- Sick AG
- Pilz GmbH & Co KG
- ABB Limited
Notable Milestones in Machine Safety Industry Sector
- October 2021: Pilz launched the PSENradar safe radar sensor, enhancing safety in challenging environments.
- February 2021: ABB supplied a customized winder safety system to Oji Fibre Solutions, showcasing advanced safety integration.
In-Depth Machine Safety Industry Market Outlook
The machine safety market is poised for sustained growth, driven by continuous technological advancements, increasing automation, and a rising focus on workplace safety. Strategic investments in R&D, strategic partnerships, and expansion into new markets will be crucial for companies to capitalize on this significant market opportunity. The increasing demand for sophisticated, integrated safety solutions presents a substantial potential for growth and innovation in the coming years.
Machine Safety Industry Segmentation
-
1. Implementation
- 1.1. Individual Components
- 1.2. Embedded Components
-
2. Component
- 2.1. Presence Sensing Safety Sensors
- 2.2. Emergency Stop Devices
- 2.3. Safety Interlock Switches
- 2.4. Safety Controller/Modules/Relays
- 2.5. Other Components
-
3. End-User
- 3.1. Electronics and Semiconductors
- 3.2. Oil and Gas
- 3.3. Healthcare
- 3.4. Food and Beverage
- 3.5. Automotive
- 3.6. Other End-Users
Machine Safety Industry Segmentation By Geography
- 1. North America
- 2. Europe
- 3. Asia Pacific
- 4. Latin America
- 5. Middle East and Africa
Machine Safety Industry REPORT HIGHLIGHTS
| Aspects | Details |
|---|---|
| Study Period | 2019-2033 |
| Base Year | 2024 |
| Estimated Year | 2025 |
| Forecast Period | 2025-2033 |
| Historical Period | 2019-2024 |
| Growth Rate | CAGR of 9.97% from 2019-2033 |
| Segmentation |
|
Table of Contents
- 1. Introduction
- 1.1. Research Scope
- 1.2. Market Segmentation
- 1.3. Research Methodology
- 1.4. Definitions and Assumptions
- 2. Executive Summary
- 2.1. Introduction
- 3. Market Dynamics
- 3.1. Introduction
- 3.2. Market Drivers
- 3.2.1. Increasing Number of Industrial Accidents; Stringent Government Regulations and Mandatory Safety Standards
- 3.3. Market Restrains
- 3.3.1. Additional Costs Associated with Machine Safety Systems
- 3.4. Market Trends
- 3.4.1. Oil and Gas Industry to Hold a Significant Share
- 4. Market Factor Analysis
- 4.1. Porters Five Forces
- 4.2. Supply/Value Chain
- 4.3. PESTEL analysis
- 4.4. Market Entropy
- 4.5. Patent/Trademark Analysis
- 5. Global Machine Safety Industry Analysis, Insights and Forecast, 2019-2031
- 5.1. Market Analysis, Insights and Forecast - by Implementation
- 5.1.1. Individual Components
- 5.1.2. Embedded Components
- 5.2. Market Analysis, Insights and Forecast - by Component
- 5.2.1. Presence Sensing Safety Sensors
- 5.2.2. Emergency Stop Devices
- 5.2.3. Safety Interlock Switches
- 5.2.4. Safety Controller/Modules/Relays
- 5.2.5. Other Components
- 5.3. Market Analysis, Insights and Forecast - by End-User
- 5.3.1. Electronics and Semiconductors
- 5.3.2. Oil and Gas
- 5.3.3. Healthcare
- 5.3.4. Food and Beverage
- 5.3.5. Automotive
- 5.3.6. Other End-Users
- 5.4. Market Analysis, Insights and Forecast - by Region
- 5.4.1. North America
- 5.4.2. Europe
- 5.4.3. Asia Pacific
- 5.4.4. Latin America
- 5.4.5. Middle East and Africa
- 5.1. Market Analysis, Insights and Forecast - by Implementation
- 6. North America Machine Safety Industry Analysis, Insights and Forecast, 2019-2031
- 6.1. Market Analysis, Insights and Forecast - by Implementation
- 6.1.1. Individual Components
- 6.1.2. Embedded Components
- 6.2. Market Analysis, Insights and Forecast - by Component
- 6.2.1. Presence Sensing Safety Sensors
- 6.2.2. Emergency Stop Devices
- 6.2.3. Safety Interlock Switches
- 6.2.4. Safety Controller/Modules/Relays
- 6.2.5. Other Components
- 6.3. Market Analysis, Insights and Forecast - by End-User
- 6.3.1. Electronics and Semiconductors
- 6.3.2. Oil and Gas
- 6.3.3. Healthcare
- 6.3.4. Food and Beverage
- 6.3.5. Automotive
- 6.3.6. Other End-Users
- 6.1. Market Analysis, Insights and Forecast - by Implementation
- 7. Europe Machine Safety Industry Analysis, Insights and Forecast, 2019-2031
- 7.1. Market Analysis, Insights and Forecast - by Implementation
- 7.1.1. Individual Components
- 7.1.2. Embedded Components
- 7.2. Market Analysis, Insights and Forecast - by Component
- 7.2.1. Presence Sensing Safety Sensors
- 7.2.2. Emergency Stop Devices
- 7.2.3. Safety Interlock Switches
- 7.2.4. Safety Controller/Modules/Relays
- 7.2.5. Other Components
- 7.3. Market Analysis, Insights and Forecast - by End-User
- 7.3.1. Electronics and Semiconductors
- 7.3.2. Oil and Gas
- 7.3.3. Healthcare
- 7.3.4. Food and Beverage
- 7.3.5. Automotive
- 7.3.6. Other End-Users
- 7.1. Market Analysis, Insights and Forecast - by Implementation
- 8. Asia Pacific Machine Safety Industry Analysis, Insights and Forecast, 2019-2031
- 8.1. Market Analysis, Insights and Forecast - by Implementation
- 8.1.1. Individual Components
- 8.1.2. Embedded Components
- 8.2. Market Analysis, Insights and Forecast - by Component
- 8.2.1. Presence Sensing Safety Sensors
- 8.2.2. Emergency Stop Devices
- 8.2.3. Safety Interlock Switches
- 8.2.4. Safety Controller/Modules/Relays
- 8.2.5. Other Components
- 8.3. Market Analysis, Insights and Forecast - by End-User
- 8.3.1. Electronics and Semiconductors
- 8.3.2. Oil and Gas
- 8.3.3. Healthcare
- 8.3.4. Food and Beverage
- 8.3.5. Automotive
- 8.3.6. Other End-Users
- 8.1. Market Analysis, Insights and Forecast - by Implementation
- 9. Latin America Machine Safety Industry Analysis, Insights and Forecast, 2019-2031
- 9.1. Market Analysis, Insights and Forecast - by Implementation
- 9.1.1. Individual Components
- 9.1.2. Embedded Components
- 9.2. Market Analysis, Insights and Forecast - by Component
- 9.2.1. Presence Sensing Safety Sensors
- 9.2.2. Emergency Stop Devices
- 9.2.3. Safety Interlock Switches
- 9.2.4. Safety Controller/Modules/Relays
- 9.2.5. Other Components
- 9.3. Market Analysis, Insights and Forecast - by End-User
- 9.3.1. Electronics and Semiconductors
- 9.3.2. Oil and Gas
- 9.3.3. Healthcare
- 9.3.4. Food and Beverage
- 9.3.5. Automotive
- 9.3.6. Other End-Users
- 9.1. Market Analysis, Insights and Forecast - by Implementation
- 10. Middle East and Africa Machine Safety Industry Analysis, Insights and Forecast, 2019-2031
- 10.1. Market Analysis, Insights and Forecast - by Implementation
- 10.1.1. Individual Components
- 10.1.2. Embedded Components
- 10.2. Market Analysis, Insights and Forecast - by Component
- 10.2.1. Presence Sensing Safety Sensors
- 10.2.2. Emergency Stop Devices
- 10.2.3. Safety Interlock Switches
- 10.2.4. Safety Controller/Modules/Relays
- 10.2.5. Other Components
- 10.3. Market Analysis, Insights and Forecast - by End-User
- 10.3.1. Electronics and Semiconductors
- 10.3.2. Oil and Gas
- 10.3.3. Healthcare
- 10.3.4. Food and Beverage
- 10.3.5. Automotive
- 10.3.6. Other End-Users
- 10.1. Market Analysis, Insights and Forecast - by Implementation
- 11. North America Machine Safety Industry Analysis, Insights and Forecast, 2019-2031
- 11.1. Market Analysis, Insights and Forecast - By Country/Sub-region
- 11.1.1.
- 12. Europe Machine Safety Industry Analysis, Insights and Forecast, 2019-2031
- 12.1. Market Analysis, Insights and Forecast - By Country/Sub-region
- 12.1.1.
- 13. Asia Pacific Machine Safety Industry Analysis, Insights and Forecast, 2019-2031
- 13.1. Market Analysis, Insights and Forecast - By Country/Sub-region
- 13.1.1.
- 14. Latin America Machine Safety Industry Analysis, Insights and Forecast, 2019-2031
- 14.1. Market Analysis, Insights and Forecast - By Country/Sub-region
- 14.1.1.
- 15. Middle East and Africa Machine Safety Industry Analysis, Insights and Forecast, 2019-2031
- 15.1. Market Analysis, Insights and Forecast - By Country/Sub-region
- 15.1.1.
- 16. Competitive Analysis
- 16.1. Global Market Share Analysis 2024
- 16.2. Company Profiles
- 16.2.1 Rockwell Automation
- 16.2.1.1. Overview
- 16.2.1.2. Products
- 16.2.1.3. SWOT Analysis
- 16.2.1.4. Recent Developments
- 16.2.1.5. Financials (Based on Availability)
- 16.2.2 Honeywell International Inc
- 16.2.2.1. Overview
- 16.2.2.2. Products
- 16.2.2.3. SWOT Analysis
- 16.2.2.4. Recent Developments
- 16.2.2.5. Financials (Based on Availability)
- 16.2.3 Keyence Corporation
- 16.2.3.1. Overview
- 16.2.3.2. Products
- 16.2.3.3. SWOT Analysis
- 16.2.3.4. Recent Developments
- 16.2.3.5. Financials (Based on Availability)
- 16.2.4 Banner Engineerin
- 16.2.4.1. Overview
- 16.2.4.2. Products
- 16.2.4.3. SWOT Analysis
- 16.2.4.4. Recent Developments
- 16.2.4.5. Financials (Based on Availability)
- 16.2.5 IDEC Corporation
- 16.2.5.1. Overview
- 16.2.5.2. Products
- 16.2.5.3. SWOT Analysis
- 16.2.5.4. Recent Developments
- 16.2.5.5. Financials (Based on Availability)
- 16.2.6 Mitsubishi Electric Corporation
- 16.2.6.1. Overview
- 16.2.6.2. Products
- 16.2.6.3. SWOT Analysis
- 16.2.6.4. Recent Developments
- 16.2.6.5. Financials (Based on Availability)
- 16.2.7 Siemens AG
- 16.2.7.1. Overview
- 16.2.7.2. Products
- 16.2.7.3. SWOT Analysis
- 16.2.7.4. Recent Developments
- 16.2.7.5. Financials (Based on Availability)
- 16.2.8 Schneider Electric SE
- 16.2.8.1. Overview
- 16.2.8.2. Products
- 16.2.8.3. SWOT Analysis
- 16.2.8.4. Recent Developments
- 16.2.8.5. Financials (Based on Availability)
- 16.2.9 Omron Corporation
- 16.2.9.1. Overview
- 16.2.9.2. Products
- 16.2.9.3. SWOT Analysis
- 16.2.9.4. Recent Developments
- 16.2.9.5. Financials (Based on Availability)
- 16.2.10 Sick AG
- 16.2.10.1. Overview
- 16.2.10.2. Products
- 16.2.10.3. SWOT Analysis
- 16.2.10.4. Recent Developments
- 16.2.10.5. Financials (Based on Availability)
- 16.2.11 Pilz GmbH & Co KG
- 16.2.11.1. Overview
- 16.2.11.2. Products
- 16.2.11.3. SWOT Analysis
- 16.2.11.4. Recent Developments
- 16.2.11.5. Financials (Based on Availability)
- 16.2.12 ABB Limited
- 16.2.12.1. Overview
- 16.2.12.2. Products
- 16.2.12.3. SWOT Analysis
- 16.2.12.4. Recent Developments
- 16.2.12.5. Financials (Based on Availability)
- 16.2.1 Rockwell Automation
List of Figures
- Figure 1: Global Machine Safety Industry Revenue Breakdown (Million, %) by Region 2024 & 2032
- Figure 2: North America Machine Safety Industry Revenue (Million), by Country 2024 & 2032
- Figure 3: North America Machine Safety Industry Revenue Share (%), by Country 2024 & 2032
- Figure 4: Europe Machine Safety Industry Revenue (Million), by Country 2024 & 2032
- Figure 5: Europe Machine Safety Industry Revenue Share (%), by Country 2024 & 2032
- Figure 6: Asia Pacific Machine Safety Industry Revenue (Million), by Country 2024 & 2032
- Figure 7: Asia Pacific Machine Safety Industry Revenue Share (%), by Country 2024 & 2032
- Figure 8: Latin America Machine Safety Industry Revenue (Million), by Country 2024 & 2032
- Figure 9: Latin America Machine Safety Industry Revenue Share (%), by Country 2024 & 2032
- Figure 10: Middle East and Africa Machine Safety Industry Revenue (Million), by Country 2024 & 2032
- Figure 11: Middle East and Africa Machine Safety Industry Revenue Share (%), by Country 2024 & 2032
- Figure 12: North America Machine Safety Industry Revenue (Million), by Implementation 2024 & 2032
- Figure 13: North America Machine Safety Industry Revenue Share (%), by Implementation 2024 & 2032
- Figure 14: North America Machine Safety Industry Revenue (Million), by Component 2024 & 2032
- Figure 15: North America Machine Safety Industry Revenue Share (%), by Component 2024 & 2032
- Figure 16: North America Machine Safety Industry Revenue (Million), by End-User 2024 & 2032
- Figure 17: North America Machine Safety Industry Revenue Share (%), by End-User 2024 & 2032
- Figure 18: North America Machine Safety Industry Revenue (Million), by Country 2024 & 2032
- Figure 19: North America Machine Safety Industry Revenue Share (%), by Country 2024 & 2032
- Figure 20: Europe Machine Safety Industry Revenue (Million), by Implementation 2024 & 2032
- Figure 21: Europe Machine Safety Industry Revenue Share (%), by Implementation 2024 & 2032
- Figure 22: Europe Machine Safety Industry Revenue (Million), by Component 2024 & 2032
- Figure 23: Europe Machine Safety Industry Revenue Share (%), by Component 2024 & 2032
- Figure 24: Europe Machine Safety Industry Revenue (Million), by End-User 2024 & 2032
- Figure 25: Europe Machine Safety Industry Revenue Share (%), by End-User 2024 & 2032
- Figure 26: Europe Machine Safety Industry Revenue (Million), by Country 2024 & 2032
- Figure 27: Europe Machine Safety Industry Revenue Share (%), by Country 2024 & 2032
- Figure 28: Asia Pacific Machine Safety Industry Revenue (Million), by Implementation 2024 & 2032
- Figure 29: Asia Pacific Machine Safety Industry Revenue Share (%), by Implementation 2024 & 2032
- Figure 30: Asia Pacific Machine Safety Industry Revenue (Million), by Component 2024 & 2032
- Figure 31: Asia Pacific Machine Safety Industry Revenue Share (%), by Component 2024 & 2032
- Figure 32: Asia Pacific Machine Safety Industry Revenue (Million), by End-User 2024 & 2032
- Figure 33: Asia Pacific Machine Safety Industry Revenue Share (%), by End-User 2024 & 2032
- Figure 34: Asia Pacific Machine Safety Industry Revenue (Million), by Country 2024 & 2032
- Figure 35: Asia Pacific Machine Safety Industry Revenue Share (%), by Country 2024 & 2032
- Figure 36: Latin America Machine Safety Industry Revenue (Million), by Implementation 2024 & 2032
- Figure 37: Latin America Machine Safety Industry Revenue Share (%), by Implementation 2024 & 2032
- Figure 38: Latin America Machine Safety Industry Revenue (Million), by Component 2024 & 2032
- Figure 39: Latin America Machine Safety Industry Revenue Share (%), by Component 2024 & 2032
- Figure 40: Latin America Machine Safety Industry Revenue (Million), by End-User 2024 & 2032
- Figure 41: Latin America Machine Safety Industry Revenue Share (%), by End-User 2024 & 2032
- Figure 42: Latin America Machine Safety Industry Revenue (Million), by Country 2024 & 2032
- Figure 43: Latin America Machine Safety Industry Revenue Share (%), by Country 2024 & 2032
- Figure 44: Middle East and Africa Machine Safety Industry Revenue (Million), by Implementation 2024 & 2032
- Figure 45: Middle East and Africa Machine Safety Industry Revenue Share (%), by Implementation 2024 & 2032
- Figure 46: Middle East and Africa Machine Safety Industry Revenue (Million), by Component 2024 & 2032
- Figure 47: Middle East and Africa Machine Safety Industry Revenue Share (%), by Component 2024 & 2032
- Figure 48: Middle East and Africa Machine Safety Industry Revenue (Million), by End-User 2024 & 2032
- Figure 49: Middle East and Africa Machine Safety Industry Revenue Share (%), by End-User 2024 & 2032
- Figure 50: Middle East and Africa Machine Safety Industry Revenue (Million), by Country 2024 & 2032
- Figure 51: Middle East and Africa Machine Safety Industry Revenue Share (%), by Country 2024 & 2032
List of Tables
- Table 1: Global Machine Safety Industry Revenue Million Forecast, by Region 2019 & 2032
- Table 2: Global Machine Safety Industry Revenue Million Forecast, by Implementation 2019 & 2032
- Table 3: Global Machine Safety Industry Revenue Million Forecast, by Component 2019 & 2032
- Table 4: Global Machine Safety Industry Revenue Million Forecast, by End-User 2019 & 2032
- Table 5: Global Machine Safety Industry Revenue Million Forecast, by Region 2019 & 2032
- Table 6: Global Machine Safety Industry Revenue Million Forecast, by Country 2019 & 2032
- Table 7: Machine Safety Industry Revenue (Million) Forecast, by Application 2019 & 2032
- Table 8: Global Machine Safety Industry Revenue Million Forecast, by Country 2019 & 2032
- Table 9: Machine Safety Industry Revenue (Million) Forecast, by Application 2019 & 2032
- Table 10: Global Machine Safety Industry Revenue Million Forecast, by Country 2019 & 2032
- Table 11: Machine Safety Industry Revenue (Million) Forecast, by Application 2019 & 2032
- Table 12: Global Machine Safety Industry Revenue Million Forecast, by Country 2019 & 2032
- Table 13: Machine Safety Industry Revenue (Million) Forecast, by Application 2019 & 2032
- Table 14: Global Machine Safety Industry Revenue Million Forecast, by Country 2019 & 2032
- Table 15: Machine Safety Industry Revenue (Million) Forecast, by Application 2019 & 2032
- Table 16: Global Machine Safety Industry Revenue Million Forecast, by Implementation 2019 & 2032
- Table 17: Global Machine Safety Industry Revenue Million Forecast, by Component 2019 & 2032
- Table 18: Global Machine Safety Industry Revenue Million Forecast, by End-User 2019 & 2032
- Table 19: Global Machine Safety Industry Revenue Million Forecast, by Country 2019 & 2032
- Table 20: Global Machine Safety Industry Revenue Million Forecast, by Implementation 2019 & 2032
- Table 21: Global Machine Safety Industry Revenue Million Forecast, by Component 2019 & 2032
- Table 22: Global Machine Safety Industry Revenue Million Forecast, by End-User 2019 & 2032
- Table 23: Global Machine Safety Industry Revenue Million Forecast, by Country 2019 & 2032
- Table 24: Global Machine Safety Industry Revenue Million Forecast, by Implementation 2019 & 2032
- Table 25: Global Machine Safety Industry Revenue Million Forecast, by Component 2019 & 2032
- Table 26: Global Machine Safety Industry Revenue Million Forecast, by End-User 2019 & 2032
- Table 27: Global Machine Safety Industry Revenue Million Forecast, by Country 2019 & 2032
- Table 28: Global Machine Safety Industry Revenue Million Forecast, by Implementation 2019 & 2032
- Table 29: Global Machine Safety Industry Revenue Million Forecast, by Component 2019 & 2032
- Table 30: Global Machine Safety Industry Revenue Million Forecast, by End-User 2019 & 2032
- Table 31: Global Machine Safety Industry Revenue Million Forecast, by Country 2019 & 2032
- Table 32: Global Machine Safety Industry Revenue Million Forecast, by Implementation 2019 & 2032
- Table 33: Global Machine Safety Industry Revenue Million Forecast, by Component 2019 & 2032
- Table 34: Global Machine Safety Industry Revenue Million Forecast, by End-User 2019 & 2032
- Table 35: Global Machine Safety Industry Revenue Million Forecast, by Country 2019 & 2032
Frequently Asked Questions
1. What is the projected Compound Annual Growth Rate (CAGR) of the Machine Safety Industry?
The projected CAGR is approximately 9.97%.
2. Which companies are prominent players in the Machine Safety Industry?
Key companies in the market include Rockwell Automation, Honeywell International Inc, Keyence Corporation, Banner Engineerin, IDEC Corporation, Mitsubishi Electric Corporation, Siemens AG, Schneider Electric SE, Omron Corporation, Sick AG, Pilz GmbH & Co KG, ABB Limited.
3. What are the main segments of the Machine Safety Industry?
The market segments include Implementation, Component, End-User.
4. Can you provide details about the market size?
The market size is estimated to be USD 5.07 Million as of 2022.
5. What are some drivers contributing to market growth?
Increasing Number of Industrial Accidents; Stringent Government Regulations and Mandatory Safety Standards.
6. What are the notable trends driving market growth?
Oil and Gas Industry to Hold a Significant Share.
7. Are there any restraints impacting market growth?
Additional Costs Associated with Machine Safety Systems.
8. Can you provide examples of recent developments in the market?
October 2021 - Pilz launched a new safe radar sensor, PSENradar, for safe protection zone monitoring in rugged conditions such as dust, dirt, rain, light, sparks, or vibrations. The sensor can be used along with the configurable small controller PNOZmulti 2, offering an optimum solution. In addition to outdoor applications and areas in woodworking and metalworking. It also makes it possible to safeguard robot applications because the solution achieves a higher category.
9. What pricing options are available for accessing the report?
Pricing options include single-user, multi-user, and enterprise licenses priced at USD 4750, USD 5250, and USD 8750 respectively.
10. Is the market size provided in terms of value or volume?
The market size is provided in terms of value, measured in Million.
11. Are there any specific market keywords associated with the report?
Yes, the market keyword associated with the report is "Machine Safety Industry," which aids in identifying and referencing the specific market segment covered.
12. How do I determine which pricing option suits my needs best?
The pricing options vary based on user requirements and access needs. Individual users may opt for single-user licenses, while businesses requiring broader access may choose multi-user or enterprise licenses for cost-effective access to the report.
13. Are there any additional resources or data provided in the Machine Safety Industry report?
While the report offers comprehensive insights, it's advisable to review the specific contents or supplementary materials provided to ascertain if additional resources or data are available.
14. How can I stay updated on further developments or reports in the Machine Safety Industry?
To stay informed about further developments, trends, and reports in the Machine Safety Industry, consider subscribing to industry newsletters, following relevant companies and organizations, or regularly checking reputable industry news sources and publications.
Methodology
Step 1 - Identification of Relevant Samples Size from Population Database


Step 2 - Approaches for Defining Global Market Size (Value, Volume* & Price*)

Note*: In applicable scenarios
Step 3 - Data Sources
Primary Research
- Web Analytics
- Survey Reports
- Research Institute
- Latest Research Reports
- Opinion Leaders
Secondary Research
- Annual Reports
- White Paper
- Latest Press Release
- Industry Association
- Paid Database
- Investor Presentations

Step 4 - Data Triangulation
Involves using different sources of information in order to increase the validity of a study
These sources are likely to be stakeholders in a program - participants, other researchers, program staff, other community members, and so on.
Then we put all data in single framework & apply various statistical tools to find out the dynamic on the market.
During the analysis stage, feedback from the stakeholder groups would be compared to determine areas of agreement as well as areas of divergence
