

Key Insights
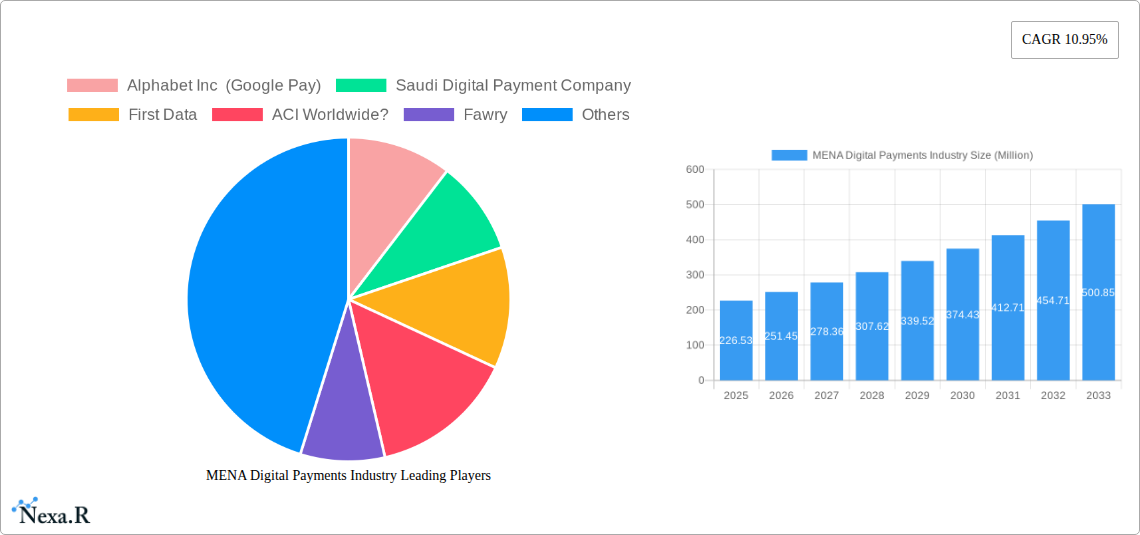
The Middle East and North Africa (MENA) digital payments industry is experiencing robust growth, driven by factors such as increasing smartphone penetration, rising internet usage, government initiatives promoting digitalization, and a burgeoning e-commerce sector. The market, valued at $226.53 million in 2025, is projected to exhibit a Compound Annual Growth Rate (CAGR) of 10.95% from 2025 to 2033. This growth is fueled by a shift away from traditional cash transactions towards more convenient and secure digital alternatives. Key players like Alphabet Inc. (Google Pay), Mastercard, PayPal, and regional fintech companies are vying for market share, fostering innovation and competition. The increasing adoption of mobile wallets, contactless payments, and buy-now-pay-later (BNPL) services is significantly contributing to the market expansion. Furthermore, the region's younger population, more comfortable with technology, is accelerating the adoption rate of digital payment solutions. Challenges remain, including infrastructure limitations in certain areas, concerns about data security and privacy, and the need for greater financial literacy among the population. However, ongoing investments in technological infrastructure and regulatory frameworks are expected to mitigate these challenges and support sustained market growth.
The regional disparity in the MENA digital payments market is notable. While countries like Saudi Arabia, the UAE, and Egypt are leading the growth trajectory, other nations are catching up. Government regulations play a significant role, with some countries implementing supportive policies to encourage digital payments. The impact of the COVID-19 pandemic accelerated the adoption of digital payments as consumers and businesses sought contactless transaction methods. Looking ahead, the integration of innovative technologies like blockchain and artificial intelligence is anticipated to further reshape the industry landscape. The long-term forecast suggests a substantial expansion of the MENA digital payments market, driven by continuous technological advancements and a growing preference for cashless transactions. The projected growth makes the MENA region an attractive market for both established and emerging players in the digital payment space.
MENA Digital Payments Industry: A Comprehensive Market Report (2019-2033)
This comprehensive report provides a deep dive into the dynamic MENA (Middle East and North Africa) digital payments industry, offering invaluable insights for industry professionals, investors, and strategists. Covering the period from 2019 to 2033, with a base year of 2025, this report meticulously analyzes market dynamics, growth trends, key players, and emerging opportunities across various segments and countries within the MENA region. The report uses Million units for all values.
MENA Digital Payments Industry Market Dynamics & Structure
This section analyzes the competitive landscape of the MENA digital payments market, examining market concentration, technological innovation, regulatory frameworks, and key industry trends. The analysis includes quantitative data on market share and M&A activity, as well as qualitative insights into innovation barriers and market dynamics. The total market size in 2025 is estimated at XXX Million.
- Market Concentration: The MENA digital payments market exhibits a moderately concentrated structure, with key players like Mastercard, PayPal, and Google Pay holding significant market share. However, the emergence of FinTech startups and regional players is leading to increased competition. In 2025, the top 5 players are estimated to hold xx% of the market share.
- Technological Innovation: The adoption of mobile wallets, contactless payments, and biometrics is driving innovation. However, challenges remain in terms of infrastructure development and digital literacy across the region.
- Regulatory Frameworks: Varying regulatory landscapes across different MENA countries impact market growth. Harmonization of regulations is crucial to facilitate cross-border payments and boost innovation.
- Competitive Product Substitutes: Traditional payment methods like cash and checks still compete with digital options, particularly in less digitally advanced markets.
- End-User Demographics: Growth is driven by a young and increasingly tech-savvy population, with a high smartphone penetration rate.
- M&A Trends: Strategic mergers and acquisitions are expected to continue shaping the MENA digital payments landscape, driving consolidation and expansion. The number of M&A deals in the period 2019-2024 was approximately xx.
MENA Digital Payments Industry Growth Trends & Insights
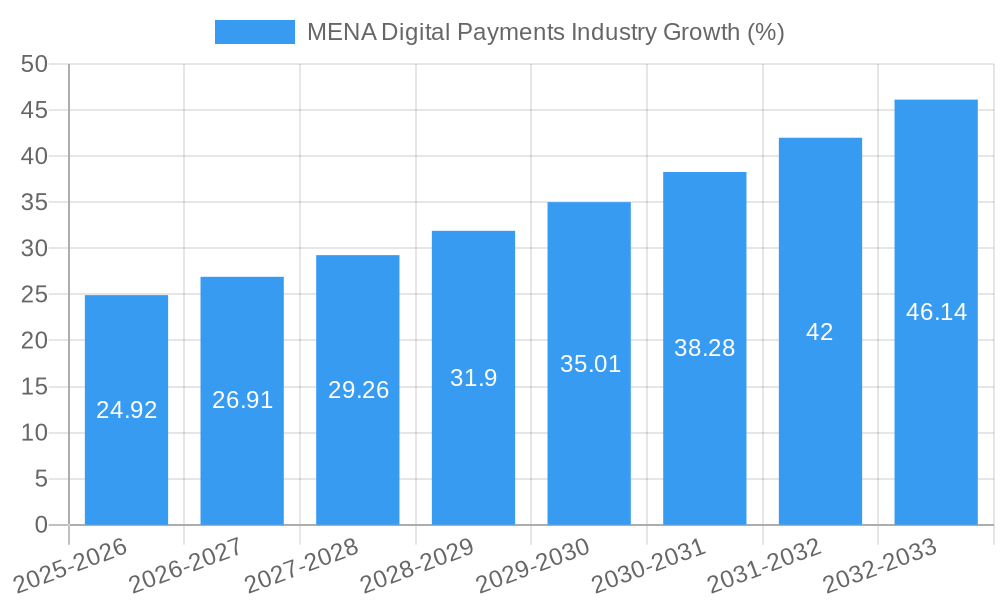
This section presents a comprehensive analysis of the MENA digital payments market's growth trajectory, utilizing extensive data analysis to provide detailed insights into market size evolution, adoption rates, technological disruptions, and consumer behavior shifts. The analysis includes projections for the forecast period (2025-2033), highlighting key growth drivers and potential challenges. The CAGR for the forecast period (2025-2033) is projected at xx%.
(This section will contain a 600-word analysis leveraging available data and trends to detail market size evolution, adoption rates, technological disruptions, and consumer behavior shifts, including specific metrics like CAGR and market penetration.)
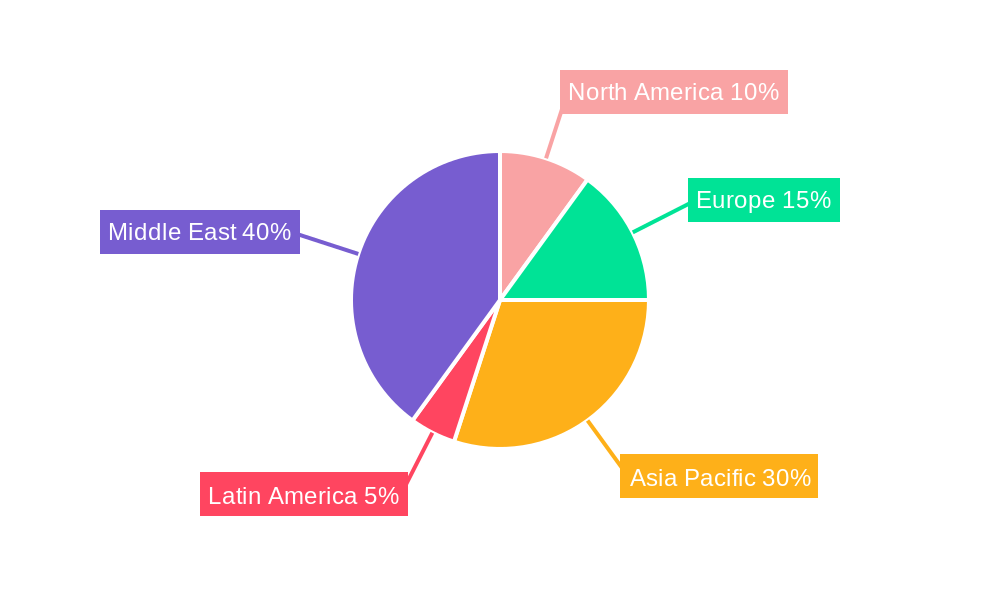
Dominant Regions, Countries, or Segments in MENA Digital Payments Industry
This section identifies the leading regions, countries, and segments within the MENA digital payments market, analyzing their dominance factors including market share, growth potential, economic policies, and infrastructure.
- Saudi Arabia: A significant driver due to government initiatives promoting digital transformation and a large population of digitally active consumers. The market size in 2025 is estimated at xx Million.
- United Arab Emirates (UAE): A leader in fintech innovation and adoption, benefiting from a robust infrastructure and supportive regulatory environment. Market size in 2025: xx Million.
- Egypt: High growth potential driven by a large population and increasing smartphone penetration, despite infrastructural challenges. Market size in 2025: xx Million.
- Impact of COVID-19 on the UAE Payment Infrastructure: The pandemic accelerated digital payments adoption in the UAE, highlighting the resilience and adaptability of its infrastructure.
- Turkey: A key market with significant growth driven by a rising digital economy. Market size in 2025: xx Million.
- Morocco: Demonstrates steady growth fueled by government support for digital financial inclusion. Market size in 2025: xx Million.
- Rest of Middle East and North Africa (Iran, Bahrain, Qatar, Oman): These markets present varying growth dynamics, influenced by unique economic and regulatory factors. The combined market size in 2025 is estimated at xx Million.
(This section will contain a 600-word analysis, using bullet points and paragraphs to further detail dominance factors, including market share and growth potential for each region/country listed above).
MENA Digital Payments Industry Product Landscape
This section offers a concise overview of the product innovations, applications, and performance metrics within the MENA digital payments industry. It highlights unique selling propositions and technological advancements, such as the rising popularity of mobile wallets, contactless payments, and buy-now-pay-later (BNPL) solutions. The increasing integration of biometric authentication and AI-driven fraud prevention is also noted.
Key Drivers, Barriers & Challenges in MENA Digital Payments Industry
This section outlines the key drivers and challenges impacting the MENA digital payments market.
Key Drivers:
- Increasing smartphone penetration and internet access.
- Government initiatives promoting digital financial inclusion.
- Growing adoption of e-commerce.
- The rise of FinTech companies.
Challenges:
- Varying levels of digital literacy across the region.
- Concerns about data security and privacy.
- Regulatory hurdles and inconsistencies.
- Infrastructure limitations in certain areas.
Emerging Opportunities in MENA Digital Payments Industry
This section highlights promising avenues for growth within the MENA digital payments market, such as the expansion of BNPL services, the integration of blockchain technology for cross-border payments, and the growing demand for personalized financial services. Untapped markets in rural areas also present significant opportunities for growth and financial inclusion.
Growth Accelerators in the MENA Digital Payments Industry
Long-term growth in the MENA digital payments industry is fueled by several key factors, including ongoing technological advancements, strategic partnerships between established financial institutions and FinTech companies, and the expansion of digital payment infrastructure across the region. Government support for digital financial inclusion, coupled with increasing consumer preference for digital payment methods, also contributes significantly to the sustained growth trajectory.
Key Players Shaping the MENA Digital Payments Industry Market
- Alphabet Inc (Google Pay)
- Saudi Digital Payment Company
- First Data
- ACI Worldwide Inc
- Fawry
- Mastercard (MasterPass)
- CIB Bank
- Paypal Holdings Inc
- Samsung Corporation
- Apple Inc
- Denarii Cas
Notable Milestones in MENA Digital Payments Industry Sector
- November 2022: Mastercard's strategic partnership with Arab African International Bank (AAIB) to accelerate Egypt's digital transformation.
- May 2022: Visa's partnership with Fundbox to provide small business-focused digital payment solutions.
In-Depth MENA Digital Payments Industry Market Outlook
The MENA digital payments market holds substantial future potential, driven by consistent technological advancements, increasing financial inclusion initiatives, and the expanding adoption of digital payment solutions across diverse segments and geographical locations. Strategic partnerships, focused on infrastructure development and regulatory harmonization, will further catalyze market growth and unlock new opportunities for market players. The overall market is poised for significant expansion, presenting attractive prospects for investors and stakeholders.
MENA Digital Payments Industry Segmentation
- 1. Production Analysis
- 2. Consumption Analysis
- 3. Import Market Analysis (Value & Volume)
- 4. Export Market Analysis (Value & Volume)
- 5. Price Trend Analysis
MENA Digital Payments Industry Segmentation By Geography
-
1. North America
- 1.1. United States
- 1.2. Canada
- 1.3. Mexico
-
2. South America
- 2.1. Brazil
- 2.2. Argentina
- 2.3. Rest of South America
-
3. Europe
- 3.1. United Kingdom
- 3.2. Germany
- 3.3. France
- 3.4. Italy
- 3.5. Spain
- 3.6. Russia
- 3.7. Benelux
- 3.8. Nordics
- 3.9. Rest of Europe
-
4. Middle East & Africa
- 4.1. Turkey
- 4.2. Israel
- 4.3. GCC
- 4.4. North Africa
- 4.5. South Africa
- 4.6. Rest of Middle East & Africa
-
5. Asia Pacific
- 5.1. China
- 5.2. India
- 5.3. Japan
- 5.4. South Korea
- 5.5. ASEAN
- 5.6. Oceania
- 5.7. Rest of Asia Pacific
MENA Digital Payments Industry REPORT HIGHLIGHTS
| Aspects | Details |
|---|---|
| Study Period | 2019-2033 |
| Base Year | 2024 |
| Estimated Year | 2025 |
| Forecast Period | 2025-2033 |
| Historical Period | 2019-2024 |
| Growth Rate | CAGR of 10.95% from 2019-2033 |
| Segmentation |
|
Table of Contents
- 1. Introduction
- 1.1. Research Scope
- 1.2. Market Segmentation
- 1.3. Research Methodology
- 1.4. Definitions and Assumptions
- 2. Executive Summary
- 2.1. Introduction
- 3. Market Dynamics
- 3.1. Introduction
- 3.2. Market Drivers
- 3.2.1. High Proliferation of Smartphones & Social Interactions; Enablement Programs by Key Retailers to Bridge the Gap Between Physical and Digital World; Launch of Real-time Payment Systems in Key GCC and North African Countries; Increasing Emphasis on Customer Satisfaction and Convergence of Global Trends in the Region
- 3.3. Market Restrains
- 3.3.1. ; Stringent Regulations in the Payments Industry
- 3.4. Market Trends
- 3.4.1. High Proliferation of Smartphones and Social Interactions to Drive the Market Growth
- 4. Market Factor Analysis
- 4.1. Porters Five Forces
- 4.2. Supply/Value Chain
- 4.3. PESTEL analysis
- 4.4. Market Entropy
- 4.5. Patent/Trademark Analysis
- 5. Global MENA Digital Payments Industry Analysis, Insights and Forecast, 2019-2031
- 5.1. Market Analysis, Insights and Forecast - by Production Analysis
- 5.2. Market Analysis, Insights and Forecast - by Consumption Analysis
- 5.3. Market Analysis, Insights and Forecast - by Import Market Analysis (Value & Volume)
- 5.4. Market Analysis, Insights and Forecast - by Export Market Analysis (Value & Volume)
- 5.5. Market Analysis, Insights and Forecast - by Price Trend Analysis
- 5.6. Market Analysis, Insights and Forecast - by Region
- 5.6.1. North America
- 5.6.2. South America
- 5.6.3. Europe
- 5.6.4. Middle East & Africa
- 5.6.5. Asia Pacific
- 5.1. Market Analysis, Insights and Forecast - by Production Analysis
- 6. North America MENA Digital Payments Industry Analysis, Insights and Forecast, 2019-2031
- 6.1. Market Analysis, Insights and Forecast - by Production Analysis
- 6.2. Market Analysis, Insights and Forecast - by Consumption Analysis
- 6.3. Market Analysis, Insights and Forecast - by Import Market Analysis (Value & Volume)
- 6.4. Market Analysis, Insights and Forecast - by Export Market Analysis (Value & Volume)
- 6.5. Market Analysis, Insights and Forecast - by Price Trend Analysis
- 6.1. Market Analysis, Insights and Forecast - by Production Analysis
- 7. South America MENA Digital Payments Industry Analysis, Insights and Forecast, 2019-2031
- 7.1. Market Analysis, Insights and Forecast - by Production Analysis
- 7.2. Market Analysis, Insights and Forecast - by Consumption Analysis
- 7.3. Market Analysis, Insights and Forecast - by Import Market Analysis (Value & Volume)
- 7.4. Market Analysis, Insights and Forecast - by Export Market Analysis (Value & Volume)
- 7.5. Market Analysis, Insights and Forecast - by Price Trend Analysis
- 7.1. Market Analysis, Insights and Forecast - by Production Analysis
- 8. Europe MENA Digital Payments Industry Analysis, Insights and Forecast, 2019-2031
- 8.1. Market Analysis, Insights and Forecast - by Production Analysis
- 8.2. Market Analysis, Insights and Forecast - by Consumption Analysis
- 8.3. Market Analysis, Insights and Forecast - by Import Market Analysis (Value & Volume)
- 8.4. Market Analysis, Insights and Forecast - by Export Market Analysis (Value & Volume)
- 8.5. Market Analysis, Insights and Forecast - by Price Trend Analysis
- 8.1. Market Analysis, Insights and Forecast - by Production Analysis
- 9. Middle East & Africa MENA Digital Payments Industry Analysis, Insights and Forecast, 2019-2031
- 9.1. Market Analysis, Insights and Forecast - by Production Analysis
- 9.2. Market Analysis, Insights and Forecast - by Consumption Analysis
- 9.3. Market Analysis, Insights and Forecast - by Import Market Analysis (Value & Volume)
- 9.4. Market Analysis, Insights and Forecast - by Export Market Analysis (Value & Volume)
- 9.5. Market Analysis, Insights and Forecast - by Price Trend Analysis
- 9.1. Market Analysis, Insights and Forecast - by Production Analysis
- 10. Asia Pacific MENA Digital Payments Industry Analysis, Insights and Forecast, 2019-2031
- 10.1. Market Analysis, Insights and Forecast - by Production Analysis
- 10.2. Market Analysis, Insights and Forecast - by Consumption Analysis
- 10.3. Market Analysis, Insights and Forecast - by Import Market Analysis (Value & Volume)
- 10.4. Market Analysis, Insights and Forecast - by Export Market Analysis (Value & Volume)
- 10.5. Market Analysis, Insights and Forecast - by Price Trend Analysis
- 10.1. Market Analysis, Insights and Forecast - by Production Analysis
- 11. North America MENA Digital Payments Industry Analysis, Insights and Forecast, 2019-2031
- 11.1. Market Analysis, Insights and Forecast - By Country/Sub-region
- 11.1.1.
- 12. Europe MENA Digital Payments Industry Analysis, Insights and Forecast, 2019-2031
- 12.1. Market Analysis, Insights and Forecast - By Country/Sub-region
- 12.1.1.
- 13. Asia Pacific MENA Digital Payments Industry Analysis, Insights and Forecast, 2019-2031
- 13.1. Market Analysis, Insights and Forecast - By Country/Sub-region
- 13.1.1.
- 14. Latin America MENA Digital Payments Industry Analysis, Insights and Forecast, 2019-2031
- 14.1. Market Analysis, Insights and Forecast - By Country/Sub-region
- 14.1.1.
- 15. Middle East MENA Digital Payments Industry Analysis, Insights and Forecast, 2019-2031
- 15.1. Market Analysis, Insights and Forecast - By Country/Sub-region
- 15.1.1.
- 16. Competitive Analysis
- 16.1. Global Market Share Analysis 2024
- 16.2. Company Profiles
- 16.2.1 Alphabet Inc (Google Pay)
- 16.2.1.1. Overview
- 16.2.1.2. Products
- 16.2.1.3. SWOT Analysis
- 16.2.1.4. Recent Developments
- 16.2.1.5. Financials (Based on Availability)
- 16.2.2 Saudi Digital Payment Company
- 16.2.2.1. Overview
- 16.2.2.2. Products
- 16.2.2.3. SWOT Analysis
- 16.2.2.4. Recent Developments
- 16.2.2.5. Financials (Based on Availability)
- 16.2.3 First Data
- 16.2.3.1. Overview
- 16.2.3.2. Products
- 16.2.3.3. SWOT Analysis
- 16.2.3.4. Recent Developments
- 16.2.3.5. Financials (Based on Availability)
- 16.2.4 ACI Worldwide?
- 16.2.4.1. Overview
- 16.2.4.2. Products
- 16.2.4.3. SWOT Analysis
- 16.2.4.4. Recent Developments
- 16.2.4.5. Financials (Based on Availability)
- 16.2.5 Fawry
- 16.2.5.1. Overview
- 16.2.5.2. Products
- 16.2.5.3. SWOT Analysis
- 16.2.5.4. Recent Developments
- 16.2.5.5. Financials (Based on Availability)
- 16.2.6 Mastercard (MasterPass)
- 16.2.6.1. Overview
- 16.2.6.2. Products
- 16.2.6.3. SWOT Analysis
- 16.2.6.4. Recent Developments
- 16.2.6.5. Financials (Based on Availability)
- 16.2.7 CIB Bank
- 16.2.7.1. Overview
- 16.2.7.2. Products
- 16.2.7.3. SWOT Analysis
- 16.2.7.4. Recent Developments
- 16.2.7.5. Financials (Based on Availability)
- 16.2.8 ACI Worldwide Inc
- 16.2.8.1. Overview
- 16.2.8.2. Products
- 16.2.8.3. SWOT Analysis
- 16.2.8.4. Recent Developments
- 16.2.8.5. Financials (Based on Availability)
- 16.2.9 Paypal Holdings Inc
- 16.2.9.1. Overview
- 16.2.9.2. Products
- 16.2.9.3. SWOT Analysis
- 16.2.9.4. Recent Developments
- 16.2.9.5. Financials (Based on Availability)
- 16.2.10 Samsung Corporation
- 16.2.10.1. Overview
- 16.2.10.2. Products
- 16.2.10.3. SWOT Analysis
- 16.2.10.4. Recent Developments
- 16.2.10.5. Financials (Based on Availability)
- 16.2.11 Apple Inc
- 16.2.11.1. Overview
- 16.2.11.2. Products
- 16.2.11.3. SWOT Analysis
- 16.2.11.4. Recent Developments
- 16.2.11.5. Financials (Based on Availability)
- 16.2.12 Denarii Cas
- 16.2.12.1. Overview
- 16.2.12.2. Products
- 16.2.12.3. SWOT Analysis
- 16.2.12.4. Recent Developments
- 16.2.12.5. Financials (Based on Availability)
- 16.2.1 Alphabet Inc (Google Pay)
List of Figures
- Figure 1: Global MENA Digital Payments Industry Revenue Breakdown (Million, %) by Region 2024 & 2032
- Figure 2: North America MENA Digital Payments Industry Revenue (Million), by Country 2024 & 2032
- Figure 3: North America MENA Digital Payments Industry Revenue Share (%), by Country 2024 & 2032
- Figure 4: Europe MENA Digital Payments Industry Revenue (Million), by Country 2024 & 2032
- Figure 5: Europe MENA Digital Payments Industry Revenue Share (%), by Country 2024 & 2032
- Figure 6: Asia Pacific MENA Digital Payments Industry Revenue (Million), by Country 2024 & 2032
- Figure 7: Asia Pacific MENA Digital Payments Industry Revenue Share (%), by Country 2024 & 2032
- Figure 8: Latin America MENA Digital Payments Industry Revenue (Million), by Country 2024 & 2032
- Figure 9: Latin America MENA Digital Payments Industry Revenue Share (%), by Country 2024 & 2032
- Figure 10: Middle East MENA Digital Payments Industry Revenue (Million), by Country 2024 & 2032
- Figure 11: Middle East MENA Digital Payments Industry Revenue Share (%), by Country 2024 & 2032
- Figure 12: North America MENA Digital Payments Industry Revenue (Million), by Production Analysis 2024 & 2032
- Figure 13: North America MENA Digital Payments Industry Revenue Share (%), by Production Analysis 2024 & 2032
- Figure 14: North America MENA Digital Payments Industry Revenue (Million), by Consumption Analysis 2024 & 2032
- Figure 15: North America MENA Digital Payments Industry Revenue Share (%), by Consumption Analysis 2024 & 2032
- Figure 16: North America MENA Digital Payments Industry Revenue (Million), by Import Market Analysis (Value & Volume) 2024 & 2032
- Figure 17: North America MENA Digital Payments Industry Revenue Share (%), by Import Market Analysis (Value & Volume) 2024 & 2032
- Figure 18: North America MENA Digital Payments Industry Revenue (Million), by Export Market Analysis (Value & Volume) 2024 & 2032
- Figure 19: North America MENA Digital Payments Industry Revenue Share (%), by Export Market Analysis (Value & Volume) 2024 & 2032
- Figure 20: North America MENA Digital Payments Industry Revenue (Million), by Price Trend Analysis 2024 & 2032
- Figure 21: North America MENA Digital Payments Industry Revenue Share (%), by Price Trend Analysis 2024 & 2032
- Figure 22: North America MENA Digital Payments Industry Revenue (Million), by Country 2024 & 2032
- Figure 23: North America MENA Digital Payments Industry Revenue Share (%), by Country 2024 & 2032
- Figure 24: South America MENA Digital Payments Industry Revenue (Million), by Production Analysis 2024 & 2032
- Figure 25: South America MENA Digital Payments Industry Revenue Share (%), by Production Analysis 2024 & 2032
- Figure 26: South America MENA Digital Payments Industry Revenue (Million), by Consumption Analysis 2024 & 2032
- Figure 27: South America MENA Digital Payments Industry Revenue Share (%), by Consumption Analysis 2024 & 2032
- Figure 28: South America MENA Digital Payments Industry Revenue (Million), by Import Market Analysis (Value & Volume) 2024 & 2032
- Figure 29: South America MENA Digital Payments Industry Revenue Share (%), by Import Market Analysis (Value & Volume) 2024 & 2032
- Figure 30: South America MENA Digital Payments Industry Revenue (Million), by Export Market Analysis (Value & Volume) 2024 & 2032
- Figure 31: South America MENA Digital Payments Industry Revenue Share (%), by Export Market Analysis (Value & Volume) 2024 & 2032
- Figure 32: South America MENA Digital Payments Industry Revenue (Million), by Price Trend Analysis 2024 & 2032
- Figure 33: South America MENA Digital Payments Industry Revenue Share (%), by Price Trend Analysis 2024 & 2032
- Figure 34: South America MENA Digital Payments Industry Revenue (Million), by Country 2024 & 2032
- Figure 35: South America MENA Digital Payments Industry Revenue Share (%), by Country 2024 & 2032
- Figure 36: Europe MENA Digital Payments Industry Revenue (Million), by Production Analysis 2024 & 2032
- Figure 37: Europe MENA Digital Payments Industry Revenue Share (%), by Production Analysis 2024 & 2032
- Figure 38: Europe MENA Digital Payments Industry Revenue (Million), by Consumption Analysis 2024 & 2032
- Figure 39: Europe MENA Digital Payments Industry Revenue Share (%), by Consumption Analysis 2024 & 2032
- Figure 40: Europe MENA Digital Payments Industry Revenue (Million), by Import Market Analysis (Value & Volume) 2024 & 2032
- Figure 41: Europe MENA Digital Payments Industry Revenue Share (%), by Import Market Analysis (Value & Volume) 2024 & 2032
- Figure 42: Europe MENA Digital Payments Industry Revenue (Million), by Export Market Analysis (Value & Volume) 2024 & 2032
- Figure 43: Europe MENA Digital Payments Industry Revenue Share (%), by Export Market Analysis (Value & Volume) 2024 & 2032
- Figure 44: Europe MENA Digital Payments Industry Revenue (Million), by Price Trend Analysis 2024 & 2032
- Figure 45: Europe MENA Digital Payments Industry Revenue Share (%), by Price Trend Analysis 2024 & 2032
- Figure 46: Europe MENA Digital Payments Industry Revenue (Million), by Country 2024 & 2032
- Figure 47: Europe MENA Digital Payments Industry Revenue Share (%), by Country 2024 & 2032
- Figure 48: Middle East & Africa MENA Digital Payments Industry Revenue (Million), by Production Analysis 2024 & 2032
- Figure 49: Middle East & Africa MENA Digital Payments Industry Revenue Share (%), by Production Analysis 2024 & 2032
- Figure 50: Middle East & Africa MENA Digital Payments Industry Revenue (Million), by Consumption Analysis 2024 & 2032
- Figure 51: Middle East & Africa MENA Digital Payments Industry Revenue Share (%), by Consumption Analysis 2024 & 2032
- Figure 52: Middle East & Africa MENA Digital Payments Industry Revenue (Million), by Import Market Analysis (Value & Volume) 2024 & 2032
- Figure 53: Middle East & Africa MENA Digital Payments Industry Revenue Share (%), by Import Market Analysis (Value & Volume) 2024 & 2032
- Figure 54: Middle East & Africa MENA Digital Payments Industry Revenue (Million), by Export Market Analysis (Value & Volume) 2024 & 2032
- Figure 55: Middle East & Africa MENA Digital Payments Industry Revenue Share (%), by Export Market Analysis (Value & Volume) 2024 & 2032
- Figure 56: Middle East & Africa MENA Digital Payments Industry Revenue (Million), by Price Trend Analysis 2024 & 2032
- Figure 57: Middle East & Africa MENA Digital Payments Industry Revenue Share (%), by Price Trend Analysis 2024 & 2032
- Figure 58: Middle East & Africa MENA Digital Payments Industry Revenue (Million), by Country 2024 & 2032
- Figure 59: Middle East & Africa MENA Digital Payments Industry Revenue Share (%), by Country 2024 & 2032
- Figure 60: Asia Pacific MENA Digital Payments Industry Revenue (Million), by Production Analysis 2024 & 2032
- Figure 61: Asia Pacific MENA Digital Payments Industry Revenue Share (%), by Production Analysis 2024 & 2032
- Figure 62: Asia Pacific MENA Digital Payments Industry Revenue (Million), by Consumption Analysis 2024 & 2032
- Figure 63: Asia Pacific MENA Digital Payments Industry Revenue Share (%), by Consumption Analysis 2024 & 2032
- Figure 64: Asia Pacific MENA Digital Payments Industry Revenue (Million), by Import Market Analysis (Value & Volume) 2024 & 2032
- Figure 65: Asia Pacific MENA Digital Payments Industry Revenue Share (%), by Import Market Analysis (Value & Volume) 2024 & 2032
- Figure 66: Asia Pacific MENA Digital Payments Industry Revenue (Million), by Export Market Analysis (Value & Volume) 2024 & 2032
- Figure 67: Asia Pacific MENA Digital Payments Industry Revenue Share (%), by Export Market Analysis (Value & Volume) 2024 & 2032
- Figure 68: Asia Pacific MENA Digital Payments Industry Revenue (Million), by Price Trend Analysis 2024 & 2032
- Figure 69: Asia Pacific MENA Digital Payments Industry Revenue Share (%), by Price Trend Analysis 2024 & 2032
- Figure 70: Asia Pacific MENA Digital Payments Industry Revenue (Million), by Country 2024 & 2032
- Figure 71: Asia Pacific MENA Digital Payments Industry Revenue Share (%), by Country 2024 & 2032
List of Tables
- Table 1: Global MENA Digital Payments Industry Revenue Million Forecast, by Region 2019 & 2032
- Table 2: Global MENA Digital Payments Industry Revenue Million Forecast, by Production Analysis 2019 & 2032
- Table 3: Global MENA Digital Payments Industry Revenue Million Forecast, by Consumption Analysis 2019 & 2032
- Table 4: Global MENA Digital Payments Industry Revenue Million Forecast, by Import Market Analysis (Value & Volume) 2019 & 2032
- Table 5: Global MENA Digital Payments Industry Revenue Million Forecast, by Export Market Analysis (Value & Volume) 2019 & 2032
- Table 6: Global MENA Digital Payments Industry Revenue Million Forecast, by Price Trend Analysis 2019 & 2032
- Table 7: Global MENA Digital Payments Industry Revenue Million Forecast, by Region 2019 & 2032
- Table 8: Global MENA Digital Payments Industry Revenue Million Forecast, by Country 2019 & 2032
- Table 9: MENA Digital Payments Industry Revenue (Million) Forecast, by Application 2019 & 2032
- Table 10: Global MENA Digital Payments Industry Revenue Million Forecast, by Country 2019 & 2032
- Table 11: MENA Digital Payments Industry Revenue (Million) Forecast, by Application 2019 & 2032
- Table 12: Global MENA Digital Payments Industry Revenue Million Forecast, by Country 2019 & 2032
- Table 13: MENA Digital Payments Industry Revenue (Million) Forecast, by Application 2019 & 2032
- Table 14: Global MENA Digital Payments Industry Revenue Million Forecast, by Country 2019 & 2032
- Table 15: MENA Digital Payments Industry Revenue (Million) Forecast, by Application 2019 & 2032
- Table 16: Global MENA Digital Payments Industry Revenue Million Forecast, by Country 2019 & 2032
- Table 17: MENA Digital Payments Industry Revenue (Million) Forecast, by Application 2019 & 2032
- Table 18: Global MENA Digital Payments Industry Revenue Million Forecast, by Production Analysis 2019 & 2032
- Table 19: Global MENA Digital Payments Industry Revenue Million Forecast, by Consumption Analysis 2019 & 2032
- Table 20: Global MENA Digital Payments Industry Revenue Million Forecast, by Import Market Analysis (Value & Volume) 2019 & 2032
- Table 21: Global MENA Digital Payments Industry Revenue Million Forecast, by Export Market Analysis (Value & Volume) 2019 & 2032
- Table 22: Global MENA Digital Payments Industry Revenue Million Forecast, by Price Trend Analysis 2019 & 2032
- Table 23: Global MENA Digital Payments Industry Revenue Million Forecast, by Country 2019 & 2032
- Table 24: United States MENA Digital Payments Industry Revenue (Million) Forecast, by Application 2019 & 2032
- Table 25: Canada MENA Digital Payments Industry Revenue (Million) Forecast, by Application 2019 & 2032
- Table 26: Mexico MENA Digital Payments Industry Revenue (Million) Forecast, by Application 2019 & 2032
- Table 27: Global MENA Digital Payments Industry Revenue Million Forecast, by Production Analysis 2019 & 2032
- Table 28: Global MENA Digital Payments Industry Revenue Million Forecast, by Consumption Analysis 2019 & 2032
- Table 29: Global MENA Digital Payments Industry Revenue Million Forecast, by Import Market Analysis (Value & Volume) 2019 & 2032
- Table 30: Global MENA Digital Payments Industry Revenue Million Forecast, by Export Market Analysis (Value & Volume) 2019 & 2032
- Table 31: Global MENA Digital Payments Industry Revenue Million Forecast, by Price Trend Analysis 2019 & 2032
- Table 32: Global MENA Digital Payments Industry Revenue Million Forecast, by Country 2019 & 2032
- Table 33: Brazil MENA Digital Payments Industry Revenue (Million) Forecast, by Application 2019 & 2032
- Table 34: Argentina MENA Digital Payments Industry Revenue (Million) Forecast, by Application 2019 & 2032
- Table 35: Rest of South America MENA Digital Payments Industry Revenue (Million) Forecast, by Application 2019 & 2032
- Table 36: Global MENA Digital Payments Industry Revenue Million Forecast, by Production Analysis 2019 & 2032
- Table 37: Global MENA Digital Payments Industry Revenue Million Forecast, by Consumption Analysis 2019 & 2032
- Table 38: Global MENA Digital Payments Industry Revenue Million Forecast, by Import Market Analysis (Value & Volume) 2019 & 2032
- Table 39: Global MENA Digital Payments Industry Revenue Million Forecast, by Export Market Analysis (Value & Volume) 2019 & 2032
- Table 40: Global MENA Digital Payments Industry Revenue Million Forecast, by Price Trend Analysis 2019 & 2032
- Table 41: Global MENA Digital Payments Industry Revenue Million Forecast, by Country 2019 & 2032
- Table 42: United Kingdom MENA Digital Payments Industry Revenue (Million) Forecast, by Application 2019 & 2032
- Table 43: Germany MENA Digital Payments Industry Revenue (Million) Forecast, by Application 2019 & 2032
- Table 44: France MENA Digital Payments Industry Revenue (Million) Forecast, by Application 2019 & 2032
- Table 45: Italy MENA Digital Payments Industry Revenue (Million) Forecast, by Application 2019 & 2032
- Table 46: Spain MENA Digital Payments Industry Revenue (Million) Forecast, by Application 2019 & 2032
- Table 47: Russia MENA Digital Payments Industry Revenue (Million) Forecast, by Application 2019 & 2032
- Table 48: Benelux MENA Digital Payments Industry Revenue (Million) Forecast, by Application 2019 & 2032
- Table 49: Nordics MENA Digital Payments Industry Revenue (Million) Forecast, by Application 2019 & 2032
- Table 50: Rest of Europe MENA Digital Payments Industry Revenue (Million) Forecast, by Application 2019 & 2032
- Table 51: Global MENA Digital Payments Industry Revenue Million Forecast, by Production Analysis 2019 & 2032
- Table 52: Global MENA Digital Payments Industry Revenue Million Forecast, by Consumption Analysis 2019 & 2032
- Table 53: Global MENA Digital Payments Industry Revenue Million Forecast, by Import Market Analysis (Value & Volume) 2019 & 2032
- Table 54: Global MENA Digital Payments Industry Revenue Million Forecast, by Export Market Analysis (Value & Volume) 2019 & 2032
- Table 55: Global MENA Digital Payments Industry Revenue Million Forecast, by Price Trend Analysis 2019 & 2032
- Table 56: Global MENA Digital Payments Industry Revenue Million Forecast, by Country 2019 & 2032
- Table 57: Turkey MENA Digital Payments Industry Revenue (Million) Forecast, by Application 2019 & 2032
- Table 58: Israel MENA Digital Payments Industry Revenue (Million) Forecast, by Application 2019 & 2032
- Table 59: GCC MENA Digital Payments Industry Revenue (Million) Forecast, by Application 2019 & 2032
- Table 60: North Africa MENA Digital Payments Industry Revenue (Million) Forecast, by Application 2019 & 2032
- Table 61: South Africa MENA Digital Payments Industry Revenue (Million) Forecast, by Application 2019 & 2032
- Table 62: Rest of Middle East & Africa MENA Digital Payments Industry Revenue (Million) Forecast, by Application 2019 & 2032
- Table 63: Global MENA Digital Payments Industry Revenue Million Forecast, by Production Analysis 2019 & 2032
- Table 64: Global MENA Digital Payments Industry Revenue Million Forecast, by Consumption Analysis 2019 & 2032
- Table 65: Global MENA Digital Payments Industry Revenue Million Forecast, by Import Market Analysis (Value & Volume) 2019 & 2032
- Table 66: Global MENA Digital Payments Industry Revenue Million Forecast, by Export Market Analysis (Value & Volume) 2019 & 2032
- Table 67: Global MENA Digital Payments Industry Revenue Million Forecast, by Price Trend Analysis 2019 & 2032
- Table 68: Global MENA Digital Payments Industry Revenue Million Forecast, by Country 2019 & 2032
- Table 69: China MENA Digital Payments Industry Revenue (Million) Forecast, by Application 2019 & 2032
- Table 70: India MENA Digital Payments Industry Revenue (Million) Forecast, by Application 2019 & 2032
- Table 71: Japan MENA Digital Payments Industry Revenue (Million) Forecast, by Application 2019 & 2032
- Table 72: South Korea MENA Digital Payments Industry Revenue (Million) Forecast, by Application 2019 & 2032
- Table 73: ASEAN MENA Digital Payments Industry Revenue (Million) Forecast, by Application 2019 & 2032
- Table 74: Oceania MENA Digital Payments Industry Revenue (Million) Forecast, by Application 2019 & 2032
- Table 75: Rest of Asia Pacific MENA Digital Payments Industry Revenue (Million) Forecast, by Application 2019 & 2032
Frequently Asked Questions
1. What is the projected Compound Annual Growth Rate (CAGR) of the MENA Digital Payments Industry?
The projected CAGR is approximately 10.95%.
2. Which companies are prominent players in the MENA Digital Payments Industry?
Key companies in the market include Alphabet Inc (Google Pay), Saudi Digital Payment Company, First Data, ACI Worldwide?, Fawry, Mastercard (MasterPass), CIB Bank, ACI Worldwide Inc, Paypal Holdings Inc, Samsung Corporation, Apple Inc, Denarii Cas.
3. What are the main segments of the MENA Digital Payments Industry?
The market segments include Production Analysis, Consumption Analysis, Import Market Analysis (Value & Volume), Export Market Analysis (Value & Volume), Price Trend Analysis.
4. Can you provide details about the market size?
The market size is estimated to be USD 226.53 Million as of 2022.
5. What are some drivers contributing to market growth?
High Proliferation of Smartphones & Social Interactions; Enablement Programs by Key Retailers to Bridge the Gap Between Physical and Digital World; Launch of Real-time Payment Systems in Key GCC and North African Countries; Increasing Emphasis on Customer Satisfaction and Convergence of Global Trends in the Region.
6. What are the notable trends driving market growth?
High Proliferation of Smartphones and Social Interactions to Drive the Market Growth.
7. Are there any restraints impacting market growth?
; Stringent Regulations in the Payments Industry.
8. Can you provide examples of recent developments in the market?
November 2022: As part of its initiative to speed up the digital transformation of Egypt's financial ecosystem, Mastercard has announced a long-term strategic partnership with the Arab African International Bank (AAIB). Through this partnership, Mastercard and AAIB will concentrate on planning and executing AAIB's digital transformation strategy and delivering cutting-edge payment solutions that satisfy the growing consumer demand for simple and secure digital payment methods.
9. What pricing options are available for accessing the report?
Pricing options include single-user, multi-user, and enterprise licenses priced at USD 4750, USD 4950, and USD 6800 respectively.
10. Is the market size provided in terms of value or volume?
The market size is provided in terms of value, measured in Million.
11. Are there any specific market keywords associated with the report?
Yes, the market keyword associated with the report is "MENA Digital Payments Industry," which aids in identifying and referencing the specific market segment covered.
12. How do I determine which pricing option suits my needs best?
The pricing options vary based on user requirements and access needs. Individual users may opt for single-user licenses, while businesses requiring broader access may choose multi-user or enterprise licenses for cost-effective access to the report.
13. Are there any additional resources or data provided in the MENA Digital Payments Industry report?
While the report offers comprehensive insights, it's advisable to review the specific contents or supplementary materials provided to ascertain if additional resources or data are available.
14. How can I stay updated on further developments or reports in the MENA Digital Payments Industry?
To stay informed about further developments, trends, and reports in the MENA Digital Payments Industry, consider subscribing to industry newsletters, following relevant companies and organizations, or regularly checking reputable industry news sources and publications.
Methodology
Step 1 - Identification of Relevant Samples Size from Population Database


Step 2 - Approaches for Defining Global Market Size (Value, Volume* & Price*)

Note*: In applicable scenarios
Step 3 - Data Sources
Primary Research
- Web Analytics
- Survey Reports
- Research Institute
- Latest Research Reports
- Opinion Leaders
Secondary Research
- Annual Reports
- White Paper
- Latest Press Release
- Industry Association
- Paid Database
- Investor Presentations

Step 4 - Data Triangulation
Involves using different sources of information in order to increase the validity of a study
These sources are likely to be stakeholders in a program - participants, other researchers, program staff, other community members, and so on.
Then we put all data in single framework & apply various statistical tools to find out the dynamic on the market.
During the analysis stage, feedback from the stakeholder groups would be compared to determine areas of agreement as well as areas of divergence
