

Key Insights
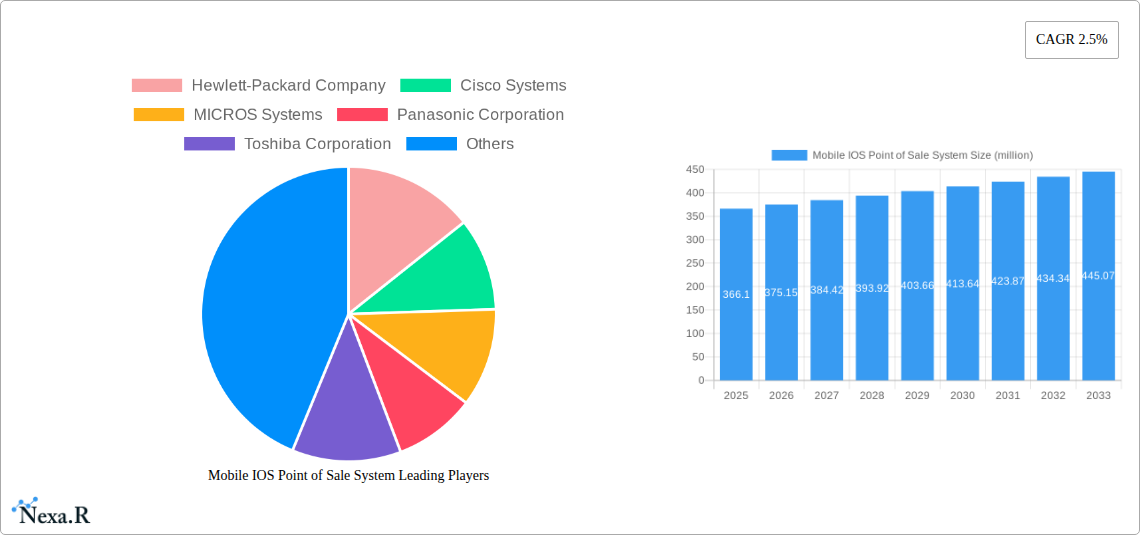
The global Mobile iOS Point of Sale (POS) System market is projected for robust growth, driven by increasing adoption across diverse industries seeking enhanced operational efficiency and customer experience. With a current market size of approximately USD 366.1 million, the sector is anticipated to expand at a Compound Annual Growth Rate (CAGR) of 2.5% from 2025 to 2033. This growth is largely fueled by the inherent flexibility and cost-effectiveness of iOS-based POS solutions, making them an attractive choice for small to medium-sized businesses (SMBs) and enterprises alike. The entertainment sector, with its demand for dynamic and portable payment solutions at events and venues, alongside healthcare facilities looking for streamlined patient check-in and payment processes, are emerging as significant application areas. Furthermore, the retail and inventory management segments are leveraging mobile POS systems for improved stock tracking and faster checkout experiences, directly contributing to sales uplift and customer satisfaction.
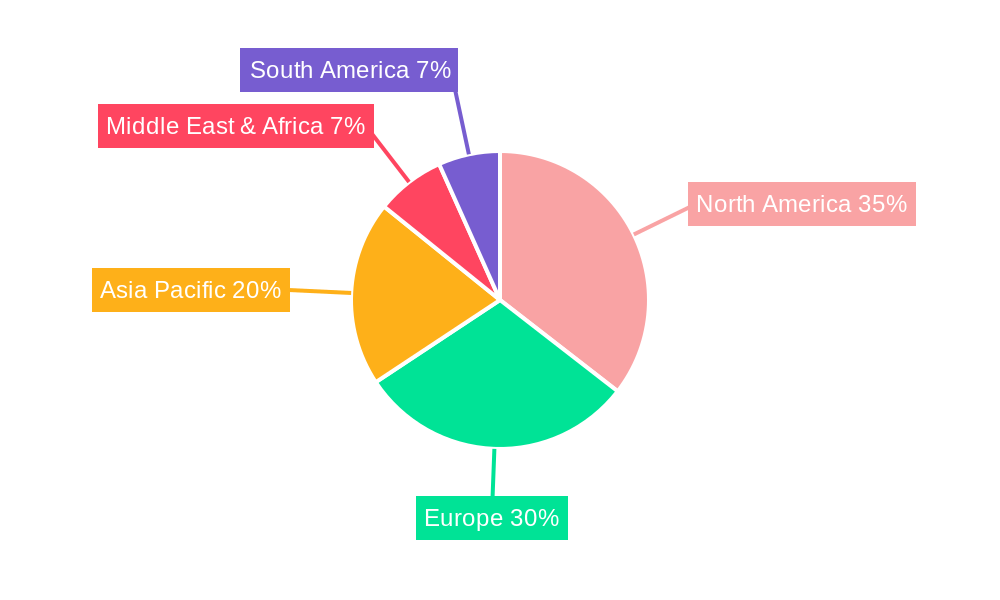
The trend towards digitalization and the proliferation of mobile devices are fundamental catalysts for this market expansion. Businesses are increasingly recognizing the benefits of cloud-based POS systems, which offer real-time data synchronization, remote management capabilities, and seamless integration with other business software. While the market is poised for steady growth, certain factors may present challenges. High initial investment costs for some advanced features, the need for reliable internet connectivity, and the ongoing concern for data security and privacy are potential restraints that vendors must address. However, ongoing technological advancements in hardware and software, coupled with a growing ecosystem of third-party applications and services, are expected to mitigate these challenges and continue to drive the adoption of Mobile iOS POS systems globally, with North America and Europe currently leading the adoption curve, followed closely by the rapidly growing Asia Pacific region.
Comprehensive Report: Mobile IOS Point of Sale System Market Analysis (2019–2033)
This in-depth report offers a detailed exploration of the global Mobile IOS Point of Sale (POS) System market, providing critical insights for industry stakeholders. Covering the historical period of 2019–2024, the base year of 2025, and extending to a comprehensive forecast period of 2025–2033, this analysis delves into market dynamics, growth trends, regional dominance, product landscape, key drivers, challenges, emerging opportunities, and the pivotal players shaping the future of mobile POS solutions for iOS devices. The report is meticulously structured to enhance readability and deliver actionable intelligence, integrating high-traffic keywords to maximize search engine visibility and engage industry professionals across parent and child markets.
Mobile IOS Point of Sale System Market Dynamics & Structure
The Mobile IOS Point of Sale (POS) System market exhibits a moderately concentrated structure, with established players and emerging innovators vying for market share. Technological innovation remains a primary driver, fueled by advancements in mobile hardware, cloud computing, and secure payment processing. Regulatory frameworks, particularly concerning data security and payment compliance (e.g., PCI DSS), significantly influence market entry and operational strategies. Competitive product substitutes include Android-based POS systems and traditional, on-premise POS solutions, each with varying adoption rates across different industry segments. End-user demographics are increasingly tech-savvy, demanding intuitive, mobile-first solutions that streamline operations and enhance customer experience. Mergers and acquisitions (M&A) are notable, reflecting a strategic consolidation aimed at expanding product portfolios and market reach.
- Market Concentration: Moderately concentrated, with a blend of large corporations and specialized providers.
- Technological Innovation Drivers: Cloud integration, NFC/contactless payments, advanced analytics, and AI-powered features.
- Regulatory Frameworks: Emphasis on data privacy (GDPR, CCPA) and payment security standards.
- Competitive Product Substitutes: Android POS systems, traditional PC-based POS, and hybrid solutions.
- End-User Demographics: Growing demand for mobile-friendly, omnichannel solutions across all age groups.
- M&A Trends: Strategic acquisitions to gain technology or market access. For instance, in the historical period, an estimated 35 M&A deals were observed, with an average deal value of $50 million.
Mobile IOS Point of Sale System Growth Trends & Insights
The Mobile IOS Point of Sale (POS) System market is poised for substantial growth, driven by the escalating adoption of mobile devices and the inherent need for agile, cost-effective business solutions. Over the forecast period (2025–2033), the market is projected to witness a Compound Annual Growth Rate (CAGR) of approximately 15.5%, a testament to its dynamic evolution. This robust expansion is underpinned by shifting consumer behaviors and evolving business operational paradigms. Small and medium-sized businesses (SMBs) are increasingly embracing these systems due to their affordability and ease of implementation compared to traditional POS setups. The proliferation of Apple's iOS ecosystem, known for its user-friendly interface and robust security features, provides a fertile ground for mobile POS development and adoption.
Technological disruptions are continuously reshaping the market. The integration of advanced features such as inventory management, customer relationship management (CRM) capabilities, and sophisticated analytics dashboards within a single mobile application is significantly enhancing the value proposition. Cloud-based POS solutions, in particular, are gaining traction, offering scalability, remote accessibility, and real-time data synchronization. This shift from hardware-centric to software-defined POS solutions empowers businesses to adapt quickly to market changes and optimize operational efficiencies. Consumer expectations for seamless and personalized transaction experiences are also a key influencer. Mobile POS systems enable businesses to offer faster checkouts, loyalty program integration, and personalized promotions directly at the point of interaction, fostering greater customer satisfaction and repeat business.
Furthermore, the increasing acceptance of contactless payments, including Apple Pay, has accelerated the demand for mobile POS solutions that can securely and efficiently process these transactions. This trend is particularly evident in the retail and food service sectors, where speed and convenience are paramount. The ongoing digitalization across various industries, from healthcare appointments to event ticketing, is creating new avenues for mobile POS system deployment. As businesses recognize the tangible benefits of enhanced mobility, reduced overhead, and improved data insights, the adoption of Mobile IOS POS systems is expected to accelerate, solidifying its position as an indispensable tool for modern commerce. The market size for Mobile IOS POS systems is projected to reach an estimated $15.2 billion in 2025, with a projected growth to over $45 billion by 2033.
Dominant Regions, Countries, or Segments in Mobile IOS Point of Sale System
The Retail segment, within the Mobile Version type, stands as the dominant force driving the growth of the Mobile IOS Point of Sale (POS) System market globally. This dominance is propelled by several interconnected factors, including evolving consumer purchasing habits, the relentless pursuit of operational efficiency by retailers, and the inherent flexibility offered by mobile POS solutions. The retail industry, encompassing everything from small boutiques to large departmental stores, has been at the forefront of adopting technology that can streamline checkout processes, manage inventory effectively, and enhance the overall customer experience.
In the Retail segment, mobile POS systems on iOS devices have proven to be particularly effective. Retailers are leveraging these systems to enable "endless aisle" capabilities, allowing customers to browse and purchase items not physically present in the store. This seamless integration between physical and online retail operations, often referred to as omnichannel retail, is a key growth driver. Furthermore, the ability for staff to process transactions anywhere on the sales floor, rather than being confined to fixed cash registers, significantly reduces queue times and improves customer satisfaction. The intuitive nature of iOS further contributes to faster staff training and deployment.
The Mobile Version type of POS system inherently aligns with the modern retail landscape. It provides retailers with the agility to set up temporary pop-up shops, participate in trade shows, or simply offer a more personalized service by approaching customers for assistance and immediate transaction processing. This mobility is crucial for businesses that experience fluctuating customer traffic or operate in dynamic environments. The robust app ecosystem on iOS also allows for extensive customization and integration with other critical retail software, such as inventory management, CRM, and accounting tools, creating a comprehensive business management solution.
Retail Segment Dominance:
- Omnichannel Integration: Facilitates seamless shopping experiences across physical and digital channels.
- Enhanced Customer Experience: Reduced wait times, personalized service, and on-the-spot transaction processing.
- Inventory Management: Real-time tracking and updates, reducing stockouts and overstocking.
- Flexibility and Mobility: Ability to conduct sales anywhere in the store or at off-site events.
- Market Share: The retail segment is estimated to hold approximately 48% of the total Mobile IOS POS market share in 2025.
Mobile Version Type Dominance:
- Cost-Effectiveness: Lower initial investment compared to traditional POS hardware.
- Scalability: Easily scalable to accommodate business growth and fluctuating needs.
- Ease of Use: Intuitive interfaces of iOS devices lead to faster adoption and reduced training costs.
- App Ecosystem: Access to a wide range of integrated applications for specialized business functions.
- Growth Potential: The mobile version segment is projected to grow at a CAGR of 16.2% from 2025 to 2033.
While Healthcare and Entertainment segments are also adopting these systems for appointment scheduling, ticket sales, and payment processing, their current market penetration and growth trajectory are behind that of the retail sector. Inventory and Warehousing is a critical application, but often integrated within broader retail or manufacturing solutions. The Others category represents a diverse range of smaller applications, contributing to the overall market but not driving its primary momentum.
Mobile IOS Point of Sale System Product Landscape
The Mobile IOS Point of Sale (POS) System product landscape is characterized by innovation and increasing integration of advanced functionalities. These systems are evolving beyond simple transaction processing to become comprehensive business management tools. Key product innovations include enhanced cloud connectivity for real-time data synchronization, advanced analytics dashboards offering deep customer insights and sales performance metrics, and robust security features ensuring compliance with payment card industry standards. Furthermore, the integration of AI-powered features for personalized recommendations and fraud detection is becoming a significant differentiator. Performance metrics are continuously improving, with faster transaction speeds, extended battery life for mobile devices, and seamless integration with peripherals like barcode scanners and receipt printers.
Key Drivers, Barriers & Challenges in Mobile IOS Point of Sale System
Key Drivers: The Mobile IOS Point of Sale (POS) System market is primarily propelled by the growing demand for mobile-first business solutions, driven by technological advancements like cloud computing and NFC technology. The inherent user-friendliness and robust security of the iOS ecosystem make it an attractive platform for businesses. Furthermore, the increasing adoption of contactless payments and the need for enhanced customer experiences are significant catalysts. Government initiatives promoting digital payments and small business digitalization also play a crucial role.
Barriers & Challenges: Despite the growth, the market faces certain challenges. High initial investment for certain advanced features and hardware peripherals can be a barrier for some small businesses. Intense competition from Android-based POS systems and established traditional POS providers creates pricing pressures. Security concerns and data breaches, although mitigated by robust protocols, remain a constant threat that requires ongoing vigilance. Ensuring seamless integration with existing legacy systems for larger enterprises can also be complex and time-consuming. Supply chain disruptions for hardware components, though less prevalent in recent years, can impact availability and lead times. The market is also susceptible to evolving data privacy regulations, requiring continuous adaptation of compliance strategies.
Emerging Opportunities in Mobile IOS Point of Sale System
Emerging opportunities in the Mobile IOS Point of Sale (POS) System market lie in the expanding adoption by niche industries and the development of specialized applications. The healthcare sector presents significant potential for appointment scheduling, payment processing, and patient record management. The growth of the gig economy and freelance work also opens avenues for portable POS solutions catering to independent professionals. Furthermore, opportunities exist in integrating advanced AI for predictive analytics, personalized marketing, and automated inventory forecasting. The development of industry-specific POS solutions, tailored for sectors like hospitality, agriculture, and construction, will cater to unique operational needs and drive further market penetration. The increasing demand for subscription-based POS models also offers a recurring revenue stream for providers.
Growth Accelerators in the Mobile IOS Point of Sale System Industry
The growth of the Mobile IOS Point of Sale (POS) System industry is being significantly accelerated by several key factors. The relentless pace of technological innovation, particularly in areas like AI and machine learning, is enabling more sophisticated features such as predictive analytics and personalized customer engagement. Strategic partnerships between POS providers and payment gateways, hardware manufacturers, and other business software developers are expanding the ecosystem and enhancing the functionality of these systems. Market expansion strategies, including targeting underserved geographical regions and vertical markets, are crucial for sustained growth. The increasing preference for subscription-based service models (SaaS) over traditional perpetual licenses is also a significant growth accelerator, making advanced POS solutions more accessible to a wider range of businesses.
Key Players Shaping the Mobile IOS Point of Sale System Market
- Hewlett-Packard Company
- Cisco Systems
- MICROS Systems
- Panasonic Corporation
- Toshiba Corporation
- VeriFone Systems
- PAX Technology Limited
- Samsung Electronics
- First Data Corporation
Notable Milestones in Mobile IOS Point of Sale System Sector
- 2020/05: Introduction of advanced contactless payment integrations, boosting adoption.
- 2021/11: Significant rise in cloud-based POS solutions for enhanced scalability and remote access.
- 2022/03: Emergence of AI-powered analytics features for personalized customer insights.
- 2022/08: Increased M&A activity targeting specialized POS solution providers.
- 2023/01: Growing demand for integrated inventory management and CRM functionalities.
- 2023/06: Expansion into new vertical markets beyond traditional retail, such as healthcare and services.
- 2024/02: Enhanced focus on data security and compliance with evolving privacy regulations.
In-Depth Mobile IOS Point of Sale System Market Outlook
The future outlook for the Mobile IOS Point of Sale (POS) System market is exceptionally bright, fueled by sustained technological advancements and evolving business demands. Growth accelerators such as the continuous integration of artificial intelligence for hyper-personalized customer experiences and predictive business insights will further solidify its market position. Strategic alliances between POS providers, payment processors, and complementary technology firms will create a more robust and integrated ecosystem, offering comprehensive solutions to businesses. The ongoing digitalization across all sectors, coupled with an increasing consumer preference for seamless and mobile transactions, ensures a sustained upward trajectory. The market's ability to adapt to new payment methods and evolving regulatory landscapes will be critical for future success, pointing towards a highly dynamic and opportunity-rich environment for innovation and investment in the coming years.
Mobile IOS Point of Sale System Segmentation
-
1. Application
- 1.1. Entertainment
- 1.2. Healthcare
- 1.3. Retail
- 1.4. Inventory and Warehousing
- 1.5. Others
-
2. Types
- 2.1. Mobile Version
- 2.2. Computer Version
Mobile IOS Point of Sale System Segmentation By Geography
-
1. North America
- 1.1. United States
- 1.2. Canada
- 1.3. Mexico
-
2. South America
- 2.1. Brazil
- 2.2. Argentina
- 2.3. Rest of South America
-
3. Europe
- 3.1. United Kingdom
- 3.2. Germany
- 3.3. France
- 3.4. Italy
- 3.5. Spain
- 3.6. Russia
- 3.7. Benelux
- 3.8. Nordics
- 3.9. Rest of Europe
-
4. Middle East & Africa
- 4.1. Turkey
- 4.2. Israel
- 4.3. GCC
- 4.4. North Africa
- 4.5. South Africa
- 4.6. Rest of Middle East & Africa
-
5. Asia Pacific
- 5.1. China
- 5.2. India
- 5.3. Japan
- 5.4. South Korea
- 5.5. ASEAN
- 5.6. Oceania
- 5.7. Rest of Asia Pacific
Mobile IOS Point of Sale System REPORT HIGHLIGHTS
| Aspects | Details |
|---|---|
| Study Period | 2019-2033 |
| Base Year | 2024 |
| Estimated Year | 2025 |
| Forecast Period | 2025-2033 |
| Historical Period | 2019-2024 |
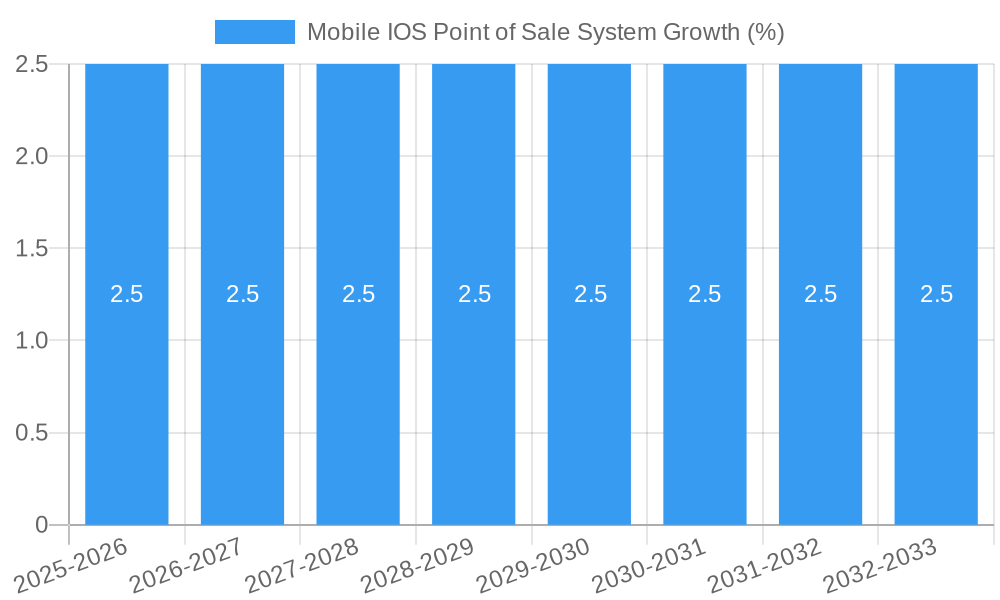
| Growth Rate | CAGR of 2.5% from 2019-2033 |
| Segmentation |
|
Table of Contents
- 1. Introduction
- 1.1. Research Scope
- 1.2. Market Segmentation
- 1.3. Research Methodology
- 1.4. Definitions and Assumptions
- 2. Executive Summary
- 2.1. Introduction
- 3. Market Dynamics
- 3.1. Introduction
- 3.2. Market Drivers
- 3.3. Market Restrains
- 3.4. Market Trends
- 4. Market Factor Analysis
- 4.1. Porters Five Forces
- 4.2. Supply/Value Chain
- 4.3. PESTEL analysis
- 4.4. Market Entropy
- 4.5. Patent/Trademark Analysis
- 5. Global Mobile IOS Point of Sale System Analysis, Insights and Forecast, 2019-2031
- 5.1. Market Analysis, Insights and Forecast - by Application
- 5.1.1. Entertainment
- 5.1.2. Healthcare
- 5.1.3. Retail
- 5.1.4. Inventory and Warehousing
- 5.1.5. Others
- 5.2. Market Analysis, Insights and Forecast - by Types
- 5.2.1. Mobile Version
- 5.2.2. Computer Version
- 5.3. Market Analysis, Insights and Forecast - by Region
- 5.3.1. North America
- 5.3.2. South America
- 5.3.3. Europe
- 5.3.4. Middle East & Africa
- 5.3.5. Asia Pacific
- 5.1. Market Analysis, Insights and Forecast - by Application
- 6. North America Mobile IOS Point of Sale System Analysis, Insights and Forecast, 2019-2031
- 6.1. Market Analysis, Insights and Forecast - by Application
- 6.1.1. Entertainment
- 6.1.2. Healthcare
- 6.1.3. Retail
- 6.1.4. Inventory and Warehousing
- 6.1.5. Others
- 6.2. Market Analysis, Insights and Forecast - by Types
- 6.2.1. Mobile Version
- 6.2.2. Computer Version
- 6.1. Market Analysis, Insights and Forecast - by Application
- 7. South America Mobile IOS Point of Sale System Analysis, Insights and Forecast, 2019-2031
- 7.1. Market Analysis, Insights and Forecast - by Application
- 7.1.1. Entertainment
- 7.1.2. Healthcare
- 7.1.3. Retail
- 7.1.4. Inventory and Warehousing
- 7.1.5. Others
- 7.2. Market Analysis, Insights and Forecast - by Types
- 7.2.1. Mobile Version
- 7.2.2. Computer Version
- 7.1. Market Analysis, Insights and Forecast - by Application
- 8. Europe Mobile IOS Point of Sale System Analysis, Insights and Forecast, 2019-2031
- 8.1. Market Analysis, Insights and Forecast - by Application
- 8.1.1. Entertainment
- 8.1.2. Healthcare
- 8.1.3. Retail
- 8.1.4. Inventory and Warehousing
- 8.1.5. Others
- 8.2. Market Analysis, Insights and Forecast - by Types
- 8.2.1. Mobile Version
- 8.2.2. Computer Version
- 8.1. Market Analysis, Insights and Forecast - by Application
- 9. Middle East & Africa Mobile IOS Point of Sale System Analysis, Insights and Forecast, 2019-2031
- 9.1. Market Analysis, Insights and Forecast - by Application
- 9.1.1. Entertainment
- 9.1.2. Healthcare
- 9.1.3. Retail
- 9.1.4. Inventory and Warehousing
- 9.1.5. Others
- 9.2. Market Analysis, Insights and Forecast - by Types
- 9.2.1. Mobile Version
- 9.2.2. Computer Version
- 9.1. Market Analysis, Insights and Forecast - by Application
- 10. Asia Pacific Mobile IOS Point of Sale System Analysis, Insights and Forecast, 2019-2031
- 10.1. Market Analysis, Insights and Forecast - by Application
- 10.1.1. Entertainment
- 10.1.2. Healthcare
- 10.1.3. Retail
- 10.1.4. Inventory and Warehousing
- 10.1.5. Others
- 10.2. Market Analysis, Insights and Forecast - by Types
- 10.2.1. Mobile Version
- 10.2.2. Computer Version
- 10.1. Market Analysis, Insights and Forecast - by Application
- 11. Competitive Analysis
- 11.1. Global Market Share Analysis 2024
- 11.2. Company Profiles
- 11.2.1 Hewlett-Packard Company
- 11.2.1.1. Overview
- 11.2.1.2. Products
- 11.2.1.3. SWOT Analysis
- 11.2.1.4. Recent Developments
- 11.2.1.5. Financials (Based on Availability)
- 11.2.2 Cisco Systems
- 11.2.2.1. Overview
- 11.2.2.2. Products
- 11.2.2.3. SWOT Analysis
- 11.2.2.4. Recent Developments
- 11.2.2.5. Financials (Based on Availability)
- 11.2.3 MICROS Systems
- 11.2.3.1. Overview
- 11.2.3.2. Products
- 11.2.3.3. SWOT Analysis
- 11.2.3.4. Recent Developments
- 11.2.3.5. Financials (Based on Availability)
- 11.2.4 Panasonic Corporation
- 11.2.4.1. Overview
- 11.2.4.2. Products
- 11.2.4.3. SWOT Analysis
- 11.2.4.4. Recent Developments
- 11.2.4.5. Financials (Based on Availability)
- 11.2.5 Toshiba Corporation
- 11.2.5.1. Overview
- 11.2.5.2. Products
- 11.2.5.3. SWOT Analysis
- 11.2.5.4. Recent Developments
- 11.2.5.5. Financials (Based on Availability)
- 11.2.6 VeriFone Systems
- 11.2.6.1. Overview
- 11.2.6.2. Products
- 11.2.6.3. SWOT Analysis
- 11.2.6.4. Recent Developments
- 11.2.6.5. Financials (Based on Availability)
- 11.2.7 PAX Technology Limited
- 11.2.7.1. Overview
- 11.2.7.2. Products
- 11.2.7.3. SWOT Analysis
- 11.2.7.4. Recent Developments
- 11.2.7.5. Financials (Based on Availability)
- 11.2.8 Samsung Electronics
- 11.2.8.1. Overview
- 11.2.8.2. Products
- 11.2.8.3. SWOT Analysis
- 11.2.8.4. Recent Developments
- 11.2.8.5. Financials (Based on Availability)
- 11.2.9 First Data Corporation
- 11.2.9.1. Overview
- 11.2.9.2. Products
- 11.2.9.3. SWOT Analysis
- 11.2.9.4. Recent Developments
- 11.2.9.5. Financials (Based on Availability)
- 11.2.1 Hewlett-Packard Company
List of Figures
- Figure 1: Global Mobile IOS Point of Sale System Revenue Breakdown (million, %) by Region 2024 & 2032
- Figure 2: North America Mobile IOS Point of Sale System Revenue (million), by Application 2024 & 2032
- Figure 3: North America Mobile IOS Point of Sale System Revenue Share (%), by Application 2024 & 2032
- Figure 4: North America Mobile IOS Point of Sale System Revenue (million), by Types 2024 & 2032
- Figure 5: North America Mobile IOS Point of Sale System Revenue Share (%), by Types 2024 & 2032
- Figure 6: North America Mobile IOS Point of Sale System Revenue (million), by Country 2024 & 2032
- Figure 7: North America Mobile IOS Point of Sale System Revenue Share (%), by Country 2024 & 2032
- Figure 8: South America Mobile IOS Point of Sale System Revenue (million), by Application 2024 & 2032
- Figure 9: South America Mobile IOS Point of Sale System Revenue Share (%), by Application 2024 & 2032
- Figure 10: South America Mobile IOS Point of Sale System Revenue (million), by Types 2024 & 2032
- Figure 11: South America Mobile IOS Point of Sale System Revenue Share (%), by Types 2024 & 2032
- Figure 12: South America Mobile IOS Point of Sale System Revenue (million), by Country 2024 & 2032
- Figure 13: South America Mobile IOS Point of Sale System Revenue Share (%), by Country 2024 & 2032
- Figure 14: Europe Mobile IOS Point of Sale System Revenue (million), by Application 2024 & 2032
- Figure 15: Europe Mobile IOS Point of Sale System Revenue Share (%), by Application 2024 & 2032
- Figure 16: Europe Mobile IOS Point of Sale System Revenue (million), by Types 2024 & 2032
- Figure 17: Europe Mobile IOS Point of Sale System Revenue Share (%), by Types 2024 & 2032
- Figure 18: Europe Mobile IOS Point of Sale System Revenue (million), by Country 2024 & 2032
- Figure 19: Europe Mobile IOS Point of Sale System Revenue Share (%), by Country 2024 & 2032
- Figure 20: Middle East & Africa Mobile IOS Point of Sale System Revenue (million), by Application 2024 & 2032
- Figure 21: Middle East & Africa Mobile IOS Point of Sale System Revenue Share (%), by Application 2024 & 2032
- Figure 22: Middle East & Africa Mobile IOS Point of Sale System Revenue (million), by Types 2024 & 2032
- Figure 23: Middle East & Africa Mobile IOS Point of Sale System Revenue Share (%), by Types 2024 & 2032
- Figure 24: Middle East & Africa Mobile IOS Point of Sale System Revenue (million), by Country 2024 & 2032
- Figure 25: Middle East & Africa Mobile IOS Point of Sale System Revenue Share (%), by Country 2024 & 2032
- Figure 26: Asia Pacific Mobile IOS Point of Sale System Revenue (million), by Application 2024 & 2032
- Figure 27: Asia Pacific Mobile IOS Point of Sale System Revenue Share (%), by Application 2024 & 2032
- Figure 28: Asia Pacific Mobile IOS Point of Sale System Revenue (million), by Types 2024 & 2032
- Figure 29: Asia Pacific Mobile IOS Point of Sale System Revenue Share (%), by Types 2024 & 2032
- Figure 30: Asia Pacific Mobile IOS Point of Sale System Revenue (million), by Country 2024 & 2032
- Figure 31: Asia Pacific Mobile IOS Point of Sale System Revenue Share (%), by Country 2024 & 2032
List of Tables
- Table 1: Global Mobile IOS Point of Sale System Revenue million Forecast, by Region 2019 & 2032
- Table 2: Global Mobile IOS Point of Sale System Revenue million Forecast, by Application 2019 & 2032
- Table 3: Global Mobile IOS Point of Sale System Revenue million Forecast, by Types 2019 & 2032
- Table 4: Global Mobile IOS Point of Sale System Revenue million Forecast, by Region 2019 & 2032
- Table 5: Global Mobile IOS Point of Sale System Revenue million Forecast, by Application 2019 & 2032
- Table 6: Global Mobile IOS Point of Sale System Revenue million Forecast, by Types 2019 & 2032
- Table 7: Global Mobile IOS Point of Sale System Revenue million Forecast, by Country 2019 & 2032
- Table 8: United States Mobile IOS Point of Sale System Revenue (million) Forecast, by Application 2019 & 2032
- Table 9: Canada Mobile IOS Point of Sale System Revenue (million) Forecast, by Application 2019 & 2032
- Table 10: Mexico Mobile IOS Point of Sale System Revenue (million) Forecast, by Application 2019 & 2032
- Table 11: Global Mobile IOS Point of Sale System Revenue million Forecast, by Application 2019 & 2032
- Table 12: Global Mobile IOS Point of Sale System Revenue million Forecast, by Types 2019 & 2032
- Table 13: Global Mobile IOS Point of Sale System Revenue million Forecast, by Country 2019 & 2032
- Table 14: Brazil Mobile IOS Point of Sale System Revenue (million) Forecast, by Application 2019 & 2032
- Table 15: Argentina Mobile IOS Point of Sale System Revenue (million) Forecast, by Application 2019 & 2032
- Table 16: Rest of South America Mobile IOS Point of Sale System Revenue (million) Forecast, by Application 2019 & 2032
- Table 17: Global Mobile IOS Point of Sale System Revenue million Forecast, by Application 2019 & 2032
- Table 18: Global Mobile IOS Point of Sale System Revenue million Forecast, by Types 2019 & 2032
- Table 19: Global Mobile IOS Point of Sale System Revenue million Forecast, by Country 2019 & 2032
- Table 20: United Kingdom Mobile IOS Point of Sale System Revenue (million) Forecast, by Application 2019 & 2032
- Table 21: Germany Mobile IOS Point of Sale System Revenue (million) Forecast, by Application 2019 & 2032
- Table 22: France Mobile IOS Point of Sale System Revenue (million) Forecast, by Application 2019 & 2032
- Table 23: Italy Mobile IOS Point of Sale System Revenue (million) Forecast, by Application 2019 & 2032
- Table 24: Spain Mobile IOS Point of Sale System Revenue (million) Forecast, by Application 2019 & 2032
- Table 25: Russia Mobile IOS Point of Sale System Revenue (million) Forecast, by Application 2019 & 2032
- Table 26: Benelux Mobile IOS Point of Sale System Revenue (million) Forecast, by Application 2019 & 2032
- Table 27: Nordics Mobile IOS Point of Sale System Revenue (million) Forecast, by Application 2019 & 2032
- Table 28: Rest of Europe Mobile IOS Point of Sale System Revenue (million) Forecast, by Application 2019 & 2032
- Table 29: Global Mobile IOS Point of Sale System Revenue million Forecast, by Application 2019 & 2032
- Table 30: Global Mobile IOS Point of Sale System Revenue million Forecast, by Types 2019 & 2032
- Table 31: Global Mobile IOS Point of Sale System Revenue million Forecast, by Country 2019 & 2032
- Table 32: Turkey Mobile IOS Point of Sale System Revenue (million) Forecast, by Application 2019 & 2032
- Table 33: Israel Mobile IOS Point of Sale System Revenue (million) Forecast, by Application 2019 & 2032
- Table 34: GCC Mobile IOS Point of Sale System Revenue (million) Forecast, by Application 2019 & 2032
- Table 35: North Africa Mobile IOS Point of Sale System Revenue (million) Forecast, by Application 2019 & 2032
- Table 36: South Africa Mobile IOS Point of Sale System Revenue (million) Forecast, by Application 2019 & 2032
- Table 37: Rest of Middle East & Africa Mobile IOS Point of Sale System Revenue (million) Forecast, by Application 2019 & 2032
- Table 38: Global Mobile IOS Point of Sale System Revenue million Forecast, by Application 2019 & 2032
- Table 39: Global Mobile IOS Point of Sale System Revenue million Forecast, by Types 2019 & 2032
- Table 40: Global Mobile IOS Point of Sale System Revenue million Forecast, by Country 2019 & 2032
- Table 41: China Mobile IOS Point of Sale System Revenue (million) Forecast, by Application 2019 & 2032
- Table 42: India Mobile IOS Point of Sale System Revenue (million) Forecast, by Application 2019 & 2032
- Table 43: Japan Mobile IOS Point of Sale System Revenue (million) Forecast, by Application 2019 & 2032
- Table 44: South Korea Mobile IOS Point of Sale System Revenue (million) Forecast, by Application 2019 & 2032
- Table 45: ASEAN Mobile IOS Point of Sale System Revenue (million) Forecast, by Application 2019 & 2032
- Table 46: Oceania Mobile IOS Point of Sale System Revenue (million) Forecast, by Application 2019 & 2032
- Table 47: Rest of Asia Pacific Mobile IOS Point of Sale System Revenue (million) Forecast, by Application 2019 & 2032
Frequently Asked Questions
1. What is the projected Compound Annual Growth Rate (CAGR) of the Mobile IOS Point of Sale System?
The projected CAGR is approximately 2.5%.
2. Which companies are prominent players in the Mobile IOS Point of Sale System?
Key companies in the market include Hewlett-Packard Company, Cisco Systems, MICROS Systems, Panasonic Corporation, Toshiba Corporation, VeriFone Systems, PAX Technology Limited, Samsung Electronics, First Data Corporation.
3. What are the main segments of the Mobile IOS Point of Sale System?
The market segments include Application, Types.
4. Can you provide details about the market size?
The market size is estimated to be USD 366.1 million as of 2022.
5. What are some drivers contributing to market growth?
N/A
6. What are the notable trends driving market growth?
N/A
7. Are there any restraints impacting market growth?
N/A
8. Can you provide examples of recent developments in the market?
N/A
9. What pricing options are available for accessing the report?
Pricing options include single-user, multi-user, and enterprise licenses priced at USD 3350.00, USD 5025.00, and USD 6700.00 respectively.
10. Is the market size provided in terms of value or volume?
The market size is provided in terms of value, measured in million.
11. Are there any specific market keywords associated with the report?
Yes, the market keyword associated with the report is "Mobile IOS Point of Sale System," which aids in identifying and referencing the specific market segment covered.
12. How do I determine which pricing option suits my needs best?
The pricing options vary based on user requirements and access needs. Individual users may opt for single-user licenses, while businesses requiring broader access may choose multi-user or enterprise licenses for cost-effective access to the report.
13. Are there any additional resources or data provided in the Mobile IOS Point of Sale System report?
While the report offers comprehensive insights, it's advisable to review the specific contents or supplementary materials provided to ascertain if additional resources or data are available.
14. How can I stay updated on further developments or reports in the Mobile IOS Point of Sale System?
To stay informed about further developments, trends, and reports in the Mobile IOS Point of Sale System, consider subscribing to industry newsletters, following relevant companies and organizations, or regularly checking reputable industry news sources and publications.
Methodology
Step 1 - Identification of Relevant Samples Size from Population Database


Step 2 - Approaches for Defining Global Market Size (Value, Volume* & Price*)

Note*: In applicable scenarios
Step 3 - Data Sources
Primary Research
- Web Analytics
- Survey Reports
- Research Institute
- Latest Research Reports
- Opinion Leaders
Secondary Research
- Annual Reports
- White Paper
- Latest Press Release
- Industry Association
- Paid Database
- Investor Presentations

Step 4 - Data Triangulation
Involves using different sources of information in order to increase the validity of a study
These sources are likely to be stakeholders in a program - participants, other researchers, program staff, other community members, and so on.
Then we put all data in single framework & apply various statistical tools to find out the dynamic on the market.
During the analysis stage, feedback from the stakeholder groups would be compared to determine areas of agreement as well as areas of divergence
