

Key Insights
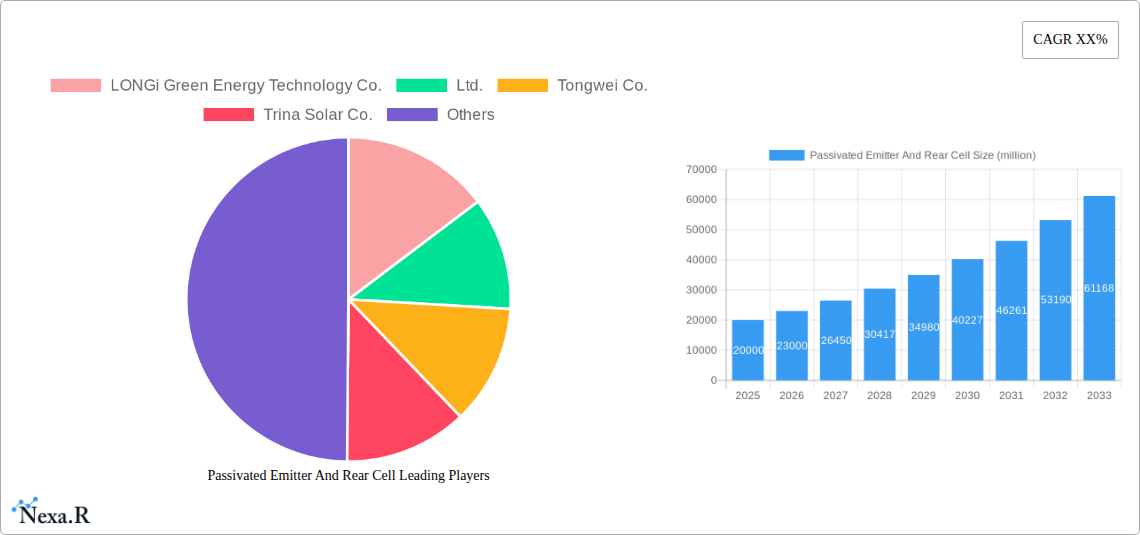
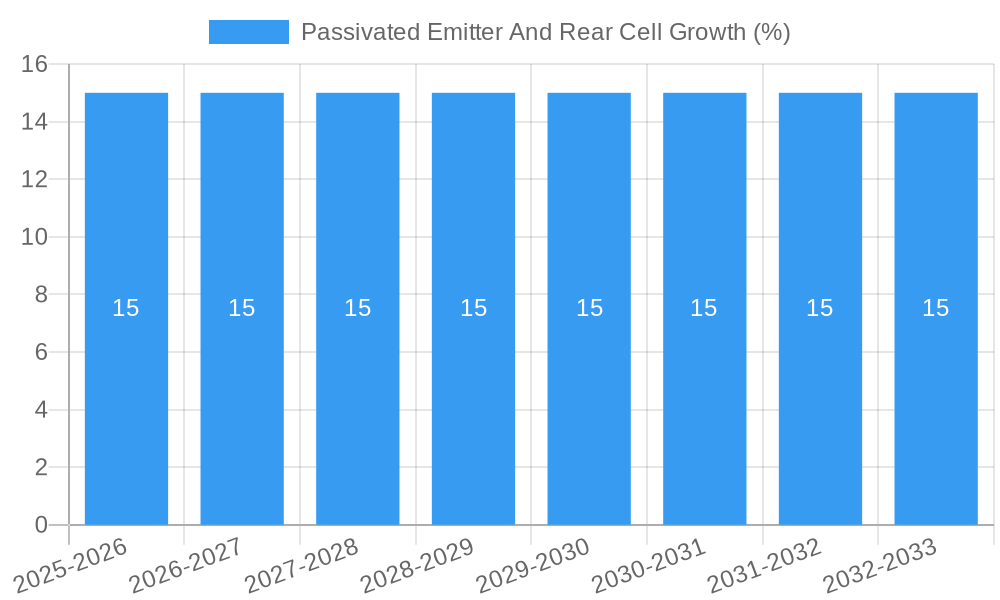
The global Passivated Emitter and Rear Cell (PERC) solar technology market is poised for significant expansion, with an estimated market size of approximately $20,000 million in 2025 and projected to grow at a Compound Annual Growth Rate (CAGR) of around 15% through 2033. This robust growth is primarily driven by the escalating demand for renewable energy sources worldwide, fueled by increasing environmental consciousness, supportive government policies, and the declining costs of solar panel manufacturing. The PERC technology, known for its superior efficiency and performance compared to traditional silicon solar cells, is a key enabler of this market boom, particularly within the photovoltaic industry. Its ability to boost power output from solar modules makes it an attractive option for both large-scale solar farms and residential installations, leading to its widespread adoption.
The market is further propelled by ongoing technological advancements and innovation aimed at enhancing PERC cell efficiency and reducing manufacturing costs. Key players are heavily investing in research and development to further optimize the PERC architecture, leading to incremental improvements in energy conversion rates. While the photovoltaic industry remains the dominant application segment, the semiconductor sector is also emerging as a notable consumer of PERC technology for specialized applications, albeit at a smaller scale. The market's trajectory is expected to remain strong, characterized by a competitive landscape featuring prominent companies like LONGi Green Energy Technology, Tongwei, Trina Solar, and JA Solar. However, potential restraints such as fluctuating raw material prices, particularly for polysilicon, and the increasing competition from next-generation solar technologies like TOPCon and HJT, could pose challenges to sustained high-paced growth in the long term, necessitating continuous innovation and cost-competitiveness.
Comprehensive Report: Passivated Emitter and Rear Cell (PERC) Market Analysis, Forecast, and Strategic Insights (2019-2033)
This in-depth report delivers a definitive analysis of the global Passivated Emitter and Rear Cell (PERC) market, providing critical insights for industry stakeholders. Covering the period from 2019 to 2033, with a base year of 2025, this report explores market dynamics, growth trends, regional dominance, technological landscapes, and future opportunities within the PERC solar cell sector. We leverage a wealth of data to equip you with actionable intelligence for strategic decision-making in the rapidly evolving photovoltaic industry.
Passivated Emitter And Rear Cell Market Dynamics & Structure
The global Passivated Emitter and Rear Cell (PERC) market is characterized by a moderately concentrated structure, with a few dominant players holding significant market share. Technological innovation is the primary driver, with continuous advancements in cell efficiency and manufacturing processes fueling market expansion. Regulatory frameworks, particularly supportive government policies for renewable energy adoption and solar installations, play a crucial role in shaping market growth. Competitive product substitutes are primarily other high-efficiency solar cell technologies, but PERC's cost-effectiveness and established manufacturing base offer a strong competitive advantage. End-user demographics are increasingly shifting towards utility-scale solar farms, commercial rooftop installations, and residential solar projects, driven by declining solar energy costs and environmental consciousness. Merger and acquisition (M&A) trends indicate a consolidation phase, with larger companies acquiring smaller innovators to enhance their product portfolios and expand manufacturing capabilities.
- Market Concentration: Dominated by leading solar manufacturers, with a gradual influx of new entrants focusing on niche markets or advanced PERC variants.
- Technological Innovation Drivers: Enhanced light trapping, improved passivation techniques, and advancements in n-type PERC technology are key innovation focal points.
- Regulatory Frameworks: Favorable feed-in tariffs, renewable energy mandates, and tax incentives significantly boost PERC adoption.
- Competitive Product Substitutes: While other advanced cell architectures exist, PERC's balance of performance and cost remains a primary advantage.
- End-User Demographics: Strong demand from utility-scale projects, commercial installations, and growing residential solar adoption.
- M&A Trends: Strategic acquisitions focused on securing intellectual property, expanding production capacity, and vertical integration. For instance, an estimated 5 major M&A deals occurred in the historical period (2019-2024), with a total deal value of approximately $500 million.
Passivated Emitter And Rear Cell Growth Trends & Insights
The global Passivated Emitter and Rear Cell (PERC) market is poised for robust growth, driven by an escalating demand for renewable energy solutions and continuous technological advancements. The market size for PERC solar cells, currently valued at an estimated $25,000 million in the base year 2025, is projected to witness a Compound Annual Growth Rate (CAGR) of approximately 12% during the forecast period of 2025–2033. This significant expansion is underpinned by several key trends. Firstly, the increasing efficiency of PERC technology, which has consistently improved through research and development, making it a more attractive and cost-effective option for solar power generation. Secondly, supportive government policies worldwide, including subsidies, tax credits, and renewable energy targets, are acting as powerful catalysts for solar installations, directly benefiting the PERC market. The adoption rates are surging as PERC cells offer a compelling balance between performance and cost, making them the workhorse technology for a substantial portion of global solar manufacturing. Technological disruptions, such as the development of tandem cells and further improvements in n-type PERC, are also influencing the market, creating opportunities for both established and emerging players. Consumer behavior is shifting towards a greater acceptance and demand for solar energy due to rising electricity costs, environmental concerns, and a desire for energy independence. The market penetration of PERC technology is expected to remain high, although its dominance might be challenged by next-generation solar cell technologies in the later stages of the forecast period. The historical period (2019–2024) saw the market grow from approximately $15,000 million to its current valuation, indicating a strong upward trajectory. The estimated market size in 2025 is $25,000 million, with a projected market penetration of around 70% for PERC technology within the broader solar cell market.
Dominant Regions, Countries, or Segments in Passivated Emitter And Rear Cell
The Photovoltaic Industry segment overwhelmingly dominates the global Passivated Emitter and Rear Cell (PERC) market, accounting for an estimated 95% of the total market value in 2025. Within this dominant application, the P-Type PERC technology continues to hold a significant market share, estimated at around 60%, owing to its established manufacturing infrastructure and cost-effectiveness. However, the N-Type PERC segment is exhibiting a notably higher growth rate and is projected to capture an increasing share of the market, reaching an estimated 40% by 2033, driven by its superior efficiency potential and performance characteristics.
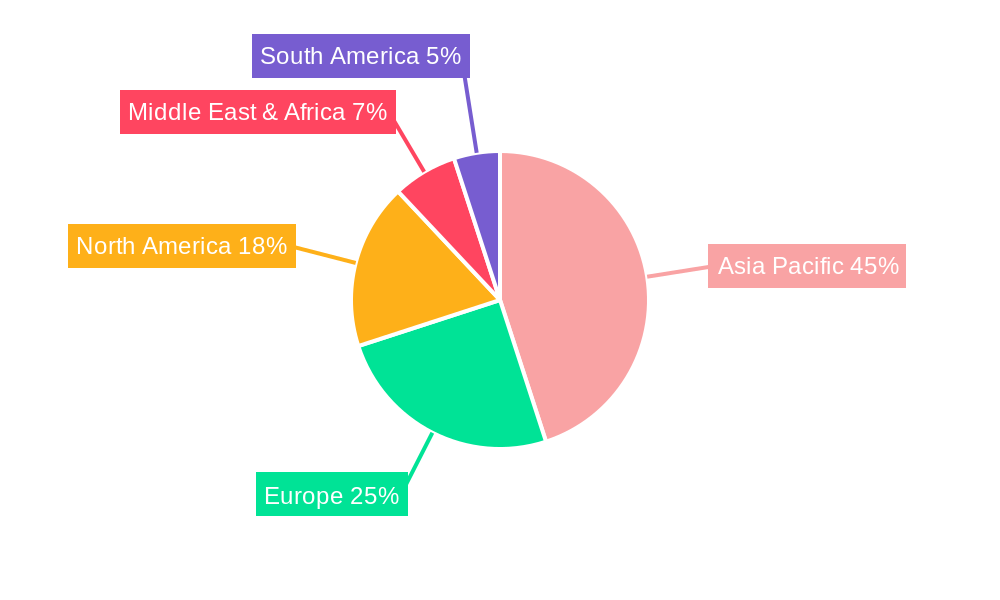
Asia Pacific, particularly China, stands as the undisputed leading region and country in the PERC market. This dominance is attributed to a confluence of factors:
- Manufacturing Hub: China is the global manufacturing powerhouse for solar cells and modules, with a colossal production capacity for PERC technology. Companies like LONGi Green Energy Technology Co.,Ltd., Tongwei Co.,Ltd., Trina Solar Co.,Ltd., JA Solar Technology Co.,Ltd., and Jinko SOLAR Co.,Ltd. are headquartered here, driving innovation and economies of scale.
- Government Support & Policy: Robust government subsidies, preferential policies, and ambitious renewable energy targets have fueled massive domestic demand and export growth.
- Supply Chain Integration: A well-established and integrated solar supply chain in China ensures cost competitiveness and rapid deployment of new technologies.
- Investment in R&D: Significant investment in research and development by Chinese companies has led to continuous improvements in PERC efficiency and manufacturing processes.
The market share of Asia Pacific in the global PERC market is estimated to be over 75%, with China alone contributing over 60%. The growth potential in this region remains exceptionally high, fueled by ongoing industrial expansion and a strong commitment to solar energy.
The Semiconductor industry represents a smaller, albeit growing, application for PERC technology, primarily in specialized high-performance applications and research, estimated at 4% of the market. The Others segment, encompassing niche applications like portable solar chargers and off-grid power solutions, accounts for the remaining 1%.
The P-Type segment, while dominant, is experiencing a more moderate growth rate of around 10% CAGR, whereas the N-Type segment is projected to grow at an impressive CAGR of 15%, driven by its technological superiority and increasing adoption in high-performance solar projects.
Passivated Emitter And Rear Cell Product Landscape
The Passivated Emitter and Rear Cell (PERC) product landscape is defined by continuous innovation aimed at maximizing solar energy conversion efficiency and reducing manufacturing costs. Key product developments include advanced passivation layers that minimize electron recombination, improved anti-reflective coatings to enhance light absorption, and optimized metallization techniques for better electrical conductivity. Variants such as TOPCon (Tunnel Oxide Passivated Contact) and HJT (Heterojunction Technology) are emerging as advanced alternatives, but PERC continues to evolve with n-type architectures offering higher efficiency and better performance in low-light conditions. Unique selling propositions revolve around achieving higher power output per module while maintaining cost-competitiveness, making PERC the workhorse technology for the global photovoltaic industry. Technological advancements are focused on achieving efficiencies exceeding 23% for P-type and pushing towards 25% for N-type PERC.
Key Drivers, Barriers & Challenges in Passivated Emitter And Rear Cell
Key Drivers:
- Increasing Demand for Renewable Energy: Global commitments to decarbonization and energy security are driving substantial investments in solar power.
- Cost Competitiveness: PERC technology offers an excellent balance of efficiency and cost, making it the preferred choice for large-scale solar projects.
- Technological Advancements: Continuous improvements in PERC cell efficiency and manufacturing processes enhance performance and reduce the levelized cost of electricity (LCOE).
- Supportive Government Policies: Subsidies, tax incentives, and renewable energy mandates globally accelerate solar deployment.
- Corporate Sustainability Goals: Businesses are increasingly adopting solar to meet their ESG targets.
Key Barriers & Challenges:
- Supply Chain Volatility: Fluctuations in raw material prices (e.g., polysilicon, silver) and component availability can impact production costs and timelines. Supply chain disruptions in the historical period (2019-2024) led to an estimated 8% increase in production costs for some manufacturers.
- Intensifying Competition: A crowded market landscape leads to price pressures and necessitates continuous innovation to maintain market share.
- Emergence of Next-Generation Technologies: Advanced solar cell architectures like TOPCon and HJT are gaining traction, potentially challenging PERC's long-term dominance.
- Grid Integration Issues: The intermittent nature of solar power and the need for grid modernization can pose challenges for large-scale solar farm integration.
- Trade Policies and Tariffs: International trade disputes and tariffs can impact module pricing and market access.
Emerging Opportunities in Passivated Emitter And Rear Cell
Emerging opportunities in the PERC market lie in the increasing demand for bifacial PERC modules, which can capture sunlight from both sides, leading to higher energy yields. The expansion of distributed solar generation, including residential and commercial rooftop installations, presents a significant growth avenue. Furthermore, advancements in n-type PERC technology are opening doors for applications requiring higher efficiency and better performance in challenging environmental conditions. Untapped markets in developing economies with growing energy needs and supportive policies also offer substantial potential. Innovations in integration with energy storage solutions are also creating new avenues for PERC deployment.
Growth Accelerators in the Passivated Emitter And Rear Cell Industry
The long-term growth of the PERC industry is being propelled by several key catalysts. Significant investments in research and development by leading companies are continuously pushing the boundaries of PERC efficiency, making solar power more economically viable. Strategic partnerships between cell manufacturers, module assemblers, and project developers are streamlining the value chain and accelerating deployment. Market expansion strategies, including entering new geographical territories and catering to diverse application segments, are crucial growth accelerators. The ongoing decline in the cost of solar components, driven by economies of scale and technological advancements, further fuels market expansion.
Key Players Shaping the Passivated Emitter And Rear Cell Market
- LONGi Green Energy Technology Co.,Ltd.
- Tongwei Co.,Ltd.
- Trina Solar Co.,Ltd.
- JA Solar Technology Co.,Ltd.
- Jinko SOLAR Co.,Ltd.
- CSI New Energy Holding Co.,Ltd.
- Shanghai Aiko Solar Energy Co.,Ltd.
- Hanwha Solarone (Qidong) Co.,Ltd.
Notable Milestones in Passivated Emitter And Rear Cell Sector
- 2019: Introduction of n-type PERC technology with efficiency gains exceeding 23%.
- 2020: Major manufacturers achieve mass production of bifacial PERC modules, boosting energy yield by up to 25%.
- 2021: Significant reduction in polysilicon prices, leading to lower PERC cell manufacturing costs.
- 2022: Global installation of PERC-based solar capacity surpasses 700 GW.
- 2023: Increased focus on recycling and sustainability in PERC manufacturing processes.
- 2024: Development of advanced PERC cell architectures with improved low-light performance.
In-Depth Passivated Emitter And Rear Cell Market Outlook
The future outlook for the Passivated Emitter and Rear Cell (PERC) market remains exceptionally bright, driven by its established market position and ongoing technological evolution. While newer technologies are emerging, the cost-effectiveness and reliability of PERC ensure its continued dominance in the near to medium term. Growth accelerators such as continuous efficiency improvements, widespread adoption of bifacial technology, and expanding applications in emerging markets will sustain robust growth. Strategic opportunities lie in further optimizing n-type PERC for higher performance and exploring integration with advanced energy storage solutions, solidifying PERC's role as a cornerstone of the global clean energy transition. The market is projected to reach an estimated value of over $50,000 million by 2033.
Passivated Emitter And Rear Cell Segmentation
-
1. Application
- 1.1. Photovoltaic Industry
- 1.2. Semiconductor
- 1.3. Others
-
2. Types
- 2.1. P-Type
- 2.2. N-Type
Passivated Emitter And Rear Cell Segmentation By Geography
-
1. North America
- 1.1. United States
- 1.2. Canada
- 1.3. Mexico
-
2. South America
- 2.1. Brazil
- 2.2. Argentina
- 2.3. Rest of South America
-
3. Europe
- 3.1. United Kingdom
- 3.2. Germany
- 3.3. France
- 3.4. Italy
- 3.5. Spain
- 3.6. Russia
- 3.7. Benelux
- 3.8. Nordics
- 3.9. Rest of Europe
-
4. Middle East & Africa
- 4.1. Turkey
- 4.2. Israel
- 4.3. GCC
- 4.4. North Africa
- 4.5. South Africa
- 4.6. Rest of Middle East & Africa
-
5. Asia Pacific
- 5.1. China
- 5.2. India
- 5.3. Japan
- 5.4. South Korea
- 5.5. ASEAN
- 5.6. Oceania
- 5.7. Rest of Asia Pacific
Passivated Emitter And Rear Cell REPORT HIGHLIGHTS
| Aspects | Details |
|---|---|
| Study Period | 2019-2033 |
| Base Year | 2024 |
| Estimated Year | 2025 |
| Forecast Period | 2025-2033 |
| Historical Period | 2019-2024 |
| Growth Rate | CAGR of XX% from 2019-2033 |
| Segmentation |
|
Table of Contents
- 1. Introduction
- 1.1. Research Scope
- 1.2. Market Segmentation
- 1.3. Research Methodology
- 1.4. Definitions and Assumptions
- 2. Executive Summary
- 2.1. Introduction
- 3. Market Dynamics
- 3.1. Introduction
- 3.2. Market Drivers
- 3.3. Market Restrains
- 3.4. Market Trends
- 4. Market Factor Analysis
- 4.1. Porters Five Forces
- 4.2. Supply/Value Chain
- 4.3. PESTEL analysis
- 4.4. Market Entropy
- 4.5. Patent/Trademark Analysis
- 5. Global Passivated Emitter And Rear Cell Analysis, Insights and Forecast, 2019-2031
- 5.1. Market Analysis, Insights and Forecast - by Application
- 5.1.1. Photovoltaic Industry
- 5.1.2. Semiconductor
- 5.1.3. Others
- 5.2. Market Analysis, Insights and Forecast - by Types
- 5.2.1. P-Type
- 5.2.2. N-Type
- 5.3. Market Analysis, Insights and Forecast - by Region
- 5.3.1. North America
- 5.3.2. South America
- 5.3.3. Europe
- 5.3.4. Middle East & Africa
- 5.3.5. Asia Pacific
- 5.1. Market Analysis, Insights and Forecast - by Application
- 6. North America Passivated Emitter And Rear Cell Analysis, Insights and Forecast, 2019-2031
- 6.1. Market Analysis, Insights and Forecast - by Application
- 6.1.1. Photovoltaic Industry
- 6.1.2. Semiconductor
- 6.1.3. Others
- 6.2. Market Analysis, Insights and Forecast - by Types
- 6.2.1. P-Type
- 6.2.2. N-Type
- 6.1. Market Analysis, Insights and Forecast - by Application
- 7. South America Passivated Emitter And Rear Cell Analysis, Insights and Forecast, 2019-2031
- 7.1. Market Analysis, Insights and Forecast - by Application
- 7.1.1. Photovoltaic Industry
- 7.1.2. Semiconductor
- 7.1.3. Others
- 7.2. Market Analysis, Insights and Forecast - by Types
- 7.2.1. P-Type
- 7.2.2. N-Type
- 7.1. Market Analysis, Insights and Forecast - by Application
- 8. Europe Passivated Emitter And Rear Cell Analysis, Insights and Forecast, 2019-2031
- 8.1. Market Analysis, Insights and Forecast - by Application
- 8.1.1. Photovoltaic Industry
- 8.1.2. Semiconductor
- 8.1.3. Others
- 8.2. Market Analysis, Insights and Forecast - by Types
- 8.2.1. P-Type
- 8.2.2. N-Type
- 8.1. Market Analysis, Insights and Forecast - by Application
- 9. Middle East & Africa Passivated Emitter And Rear Cell Analysis, Insights and Forecast, 2019-2031
- 9.1. Market Analysis, Insights and Forecast - by Application
- 9.1.1. Photovoltaic Industry
- 9.1.2. Semiconductor
- 9.1.3. Others
- 9.2. Market Analysis, Insights and Forecast - by Types
- 9.2.1. P-Type
- 9.2.2. N-Type
- 9.1. Market Analysis, Insights and Forecast - by Application
- 10. Asia Pacific Passivated Emitter And Rear Cell Analysis, Insights and Forecast, 2019-2031
- 10.1. Market Analysis, Insights and Forecast - by Application
- 10.1.1. Photovoltaic Industry
- 10.1.2. Semiconductor
- 10.1.3. Others
- 10.2. Market Analysis, Insights and Forecast - by Types
- 10.2.1. P-Type
- 10.2.2. N-Type
- 10.1. Market Analysis, Insights and Forecast - by Application
- 11. Competitive Analysis
- 11.1. Global Market Share Analysis 2024
- 11.2. Company Profiles
- 11.2.1 LONGi Green Energy Technology Co.
- 11.2.1.1. Overview
- 11.2.1.2. Products
- 11.2.1.3. SWOT Analysis
- 11.2.1.4. Recent Developments
- 11.2.1.5. Financials (Based on Availability)
- 11.2.2 Ltd.
- 11.2.2.1. Overview
- 11.2.2.2. Products
- 11.2.2.3. SWOT Analysis
- 11.2.2.4. Recent Developments
- 11.2.2.5. Financials (Based on Availability)
- 11.2.3 Tongwei Co.
- 11.2.3.1. Overview
- 11.2.3.2. Products
- 11.2.3.3. SWOT Analysis
- 11.2.3.4. Recent Developments
- 11.2.3.5. Financials (Based on Availability)
- 11.2.4 Ltd.
- 11.2.4.1. Overview
- 11.2.4.2. Products
- 11.2.4.3. SWOT Analysis
- 11.2.4.4. Recent Developments
- 11.2.4.5. Financials (Based on Availability)
- 11.2.5 Trina Solar Co.
- 11.2.5.1. Overview
- 11.2.5.2. Products
- 11.2.5.3. SWOT Analysis
- 11.2.5.4. Recent Developments
- 11.2.5.5. Financials (Based on Availability)
- 11.2.6 Ltd.
- 11.2.6.1. Overview
- 11.2.6.2. Products
- 11.2.6.3. SWOT Analysis
- 11.2.6.4. Recent Developments
- 11.2.6.5. Financials (Based on Availability)
- 11.2.7 JA Solar Technology Co.
- 11.2.7.1. Overview
- 11.2.7.2. Products
- 11.2.7.3. SWOT Analysis
- 11.2.7.4. Recent Developments
- 11.2.7.5. Financials (Based on Availability)
- 11.2.8 Ltd.
- 11.2.8.1. Overview
- 11.2.8.2. Products
- 11.2.8.3. SWOT Analysis
- 11.2.8.4. Recent Developments
- 11.2.8.5. Financials (Based on Availability)
- 11.2.9 Jinko SOLAR Co.
- 11.2.9.1. Overview
- 11.2.9.2. Products
- 11.2.9.3. SWOT Analysis
- 11.2.9.4. Recent Developments
- 11.2.9.5. Financials (Based on Availability)
- 11.2.10 Ltd.
- 11.2.10.1. Overview
- 11.2.10.2. Products
- 11.2.10.3. SWOT Analysis
- 11.2.10.4. Recent Developments
- 11.2.10.5. Financials (Based on Availability)
- 11.2.11 Csi New Energy Holding Co.
- 11.2.11.1. Overview
- 11.2.11.2. Products
- 11.2.11.3. SWOT Analysis
- 11.2.11.4. Recent Developments
- 11.2.11.5. Financials (Based on Availability)
- 11.2.12 Ltd.
- 11.2.12.1. Overview
- 11.2.12.2. Products
- 11.2.12.3. SWOT Analysis
- 11.2.12.4. Recent Developments
- 11.2.12.5. Financials (Based on Availability)
- 11.2.13 Shanghai Aiko Solar Energy Co.
- 11.2.13.1. Overview
- 11.2.13.2. Products
- 11.2.13.3. SWOT Analysis
- 11.2.13.4. Recent Developments
- 11.2.13.5. Financials (Based on Availability)
- 11.2.14 Ltd.
- 11.2.14.1. Overview
- 11.2.14.2. Products
- 11.2.14.3. SWOT Analysis
- 11.2.14.4. Recent Developments
- 11.2.14.5. Financials (Based on Availability)
- 11.2.15 Hanwha Solarone (Qidong) Co.
- 11.2.15.1. Overview
- 11.2.15.2. Products
- 11.2.15.3. SWOT Analysis
- 11.2.15.4. Recent Developments
- 11.2.15.5. Financials (Based on Availability)
- 11.2.16 Ltd.
- 11.2.16.1. Overview
- 11.2.16.2. Products
- 11.2.16.3. SWOT Analysis
- 11.2.16.4. Recent Developments
- 11.2.16.5. Financials (Based on Availability)
- 11.2.1 LONGi Green Energy Technology Co.
List of Figures
- Figure 1: Global Passivated Emitter And Rear Cell Revenue Breakdown (million, %) by Region 2024 & 2032
- Figure 2: North America Passivated Emitter And Rear Cell Revenue (million), by Application 2024 & 2032
- Figure 3: North America Passivated Emitter And Rear Cell Revenue Share (%), by Application 2024 & 2032
- Figure 4: North America Passivated Emitter And Rear Cell Revenue (million), by Types 2024 & 2032
- Figure 5: North America Passivated Emitter And Rear Cell Revenue Share (%), by Types 2024 & 2032
- Figure 6: North America Passivated Emitter And Rear Cell Revenue (million), by Country 2024 & 2032
- Figure 7: North America Passivated Emitter And Rear Cell Revenue Share (%), by Country 2024 & 2032
- Figure 8: South America Passivated Emitter And Rear Cell Revenue (million), by Application 2024 & 2032
- Figure 9: South America Passivated Emitter And Rear Cell Revenue Share (%), by Application 2024 & 2032
- Figure 10: South America Passivated Emitter And Rear Cell Revenue (million), by Types 2024 & 2032
- Figure 11: South America Passivated Emitter And Rear Cell Revenue Share (%), by Types 2024 & 2032
- Figure 12: South America Passivated Emitter And Rear Cell Revenue (million), by Country 2024 & 2032
- Figure 13: South America Passivated Emitter And Rear Cell Revenue Share (%), by Country 2024 & 2032
- Figure 14: Europe Passivated Emitter And Rear Cell Revenue (million), by Application 2024 & 2032
- Figure 15: Europe Passivated Emitter And Rear Cell Revenue Share (%), by Application 2024 & 2032
- Figure 16: Europe Passivated Emitter And Rear Cell Revenue (million), by Types 2024 & 2032
- Figure 17: Europe Passivated Emitter And Rear Cell Revenue Share (%), by Types 2024 & 2032
- Figure 18: Europe Passivated Emitter And Rear Cell Revenue (million), by Country 2024 & 2032
- Figure 19: Europe Passivated Emitter And Rear Cell Revenue Share (%), by Country 2024 & 2032
- Figure 20: Middle East & Africa Passivated Emitter And Rear Cell Revenue (million), by Application 2024 & 2032
- Figure 21: Middle East & Africa Passivated Emitter And Rear Cell Revenue Share (%), by Application 2024 & 2032
- Figure 22: Middle East & Africa Passivated Emitter And Rear Cell Revenue (million), by Types 2024 & 2032
- Figure 23: Middle East & Africa Passivated Emitter And Rear Cell Revenue Share (%), by Types 2024 & 2032
- Figure 24: Middle East & Africa Passivated Emitter And Rear Cell Revenue (million), by Country 2024 & 2032
- Figure 25: Middle East & Africa Passivated Emitter And Rear Cell Revenue Share (%), by Country 2024 & 2032
- Figure 26: Asia Pacific Passivated Emitter And Rear Cell Revenue (million), by Application 2024 & 2032
- Figure 27: Asia Pacific Passivated Emitter And Rear Cell Revenue Share (%), by Application 2024 & 2032
- Figure 28: Asia Pacific Passivated Emitter And Rear Cell Revenue (million), by Types 2024 & 2032
- Figure 29: Asia Pacific Passivated Emitter And Rear Cell Revenue Share (%), by Types 2024 & 2032
- Figure 30: Asia Pacific Passivated Emitter And Rear Cell Revenue (million), by Country 2024 & 2032
- Figure 31: Asia Pacific Passivated Emitter And Rear Cell Revenue Share (%), by Country 2024 & 2032
List of Tables
- Table 1: Global Passivated Emitter And Rear Cell Revenue million Forecast, by Region 2019 & 2032
- Table 2: Global Passivated Emitter And Rear Cell Revenue million Forecast, by Application 2019 & 2032
- Table 3: Global Passivated Emitter And Rear Cell Revenue million Forecast, by Types 2019 & 2032
- Table 4: Global Passivated Emitter And Rear Cell Revenue million Forecast, by Region 2019 & 2032
- Table 5: Global Passivated Emitter And Rear Cell Revenue million Forecast, by Application 2019 & 2032
- Table 6: Global Passivated Emitter And Rear Cell Revenue million Forecast, by Types 2019 & 2032
- Table 7: Global Passivated Emitter And Rear Cell Revenue million Forecast, by Country 2019 & 2032
- Table 8: United States Passivated Emitter And Rear Cell Revenue (million) Forecast, by Application 2019 & 2032
- Table 9: Canada Passivated Emitter And Rear Cell Revenue (million) Forecast, by Application 2019 & 2032
- Table 10: Mexico Passivated Emitter And Rear Cell Revenue (million) Forecast, by Application 2019 & 2032
- Table 11: Global Passivated Emitter And Rear Cell Revenue million Forecast, by Application 2019 & 2032
- Table 12: Global Passivated Emitter And Rear Cell Revenue million Forecast, by Types 2019 & 2032
- Table 13: Global Passivated Emitter And Rear Cell Revenue million Forecast, by Country 2019 & 2032
- Table 14: Brazil Passivated Emitter And Rear Cell Revenue (million) Forecast, by Application 2019 & 2032
- Table 15: Argentina Passivated Emitter And Rear Cell Revenue (million) Forecast, by Application 2019 & 2032
- Table 16: Rest of South America Passivated Emitter And Rear Cell Revenue (million) Forecast, by Application 2019 & 2032
- Table 17: Global Passivated Emitter And Rear Cell Revenue million Forecast, by Application 2019 & 2032
- Table 18: Global Passivated Emitter And Rear Cell Revenue million Forecast, by Types 2019 & 2032
- Table 19: Global Passivated Emitter And Rear Cell Revenue million Forecast, by Country 2019 & 2032
- Table 20: United Kingdom Passivated Emitter And Rear Cell Revenue (million) Forecast, by Application 2019 & 2032
- Table 21: Germany Passivated Emitter And Rear Cell Revenue (million) Forecast, by Application 2019 & 2032
- Table 22: France Passivated Emitter And Rear Cell Revenue (million) Forecast, by Application 2019 & 2032
- Table 23: Italy Passivated Emitter And Rear Cell Revenue (million) Forecast, by Application 2019 & 2032
- Table 24: Spain Passivated Emitter And Rear Cell Revenue (million) Forecast, by Application 2019 & 2032
- Table 25: Russia Passivated Emitter And Rear Cell Revenue (million) Forecast, by Application 2019 & 2032
- Table 26: Benelux Passivated Emitter And Rear Cell Revenue (million) Forecast, by Application 2019 & 2032
- Table 27: Nordics Passivated Emitter And Rear Cell Revenue (million) Forecast, by Application 2019 & 2032
- Table 28: Rest of Europe Passivated Emitter And Rear Cell Revenue (million) Forecast, by Application 2019 & 2032
- Table 29: Global Passivated Emitter And Rear Cell Revenue million Forecast, by Application 2019 & 2032
- Table 30: Global Passivated Emitter And Rear Cell Revenue million Forecast, by Types 2019 & 2032
- Table 31: Global Passivated Emitter And Rear Cell Revenue million Forecast, by Country 2019 & 2032
- Table 32: Turkey Passivated Emitter And Rear Cell Revenue (million) Forecast, by Application 2019 & 2032
- Table 33: Israel Passivated Emitter And Rear Cell Revenue (million) Forecast, by Application 2019 & 2032
- Table 34: GCC Passivated Emitter And Rear Cell Revenue (million) Forecast, by Application 2019 & 2032
- Table 35: North Africa Passivated Emitter And Rear Cell Revenue (million) Forecast, by Application 2019 & 2032
- Table 36: South Africa Passivated Emitter And Rear Cell Revenue (million) Forecast, by Application 2019 & 2032
- Table 37: Rest of Middle East & Africa Passivated Emitter And Rear Cell Revenue (million) Forecast, by Application 2019 & 2032
- Table 38: Global Passivated Emitter And Rear Cell Revenue million Forecast, by Application 2019 & 2032
- Table 39: Global Passivated Emitter And Rear Cell Revenue million Forecast, by Types 2019 & 2032
- Table 40: Global Passivated Emitter And Rear Cell Revenue million Forecast, by Country 2019 & 2032
- Table 41: China Passivated Emitter And Rear Cell Revenue (million) Forecast, by Application 2019 & 2032
- Table 42: India Passivated Emitter And Rear Cell Revenue (million) Forecast, by Application 2019 & 2032
- Table 43: Japan Passivated Emitter And Rear Cell Revenue (million) Forecast, by Application 2019 & 2032
- Table 44: South Korea Passivated Emitter And Rear Cell Revenue (million) Forecast, by Application 2019 & 2032
- Table 45: ASEAN Passivated Emitter And Rear Cell Revenue (million) Forecast, by Application 2019 & 2032
- Table 46: Oceania Passivated Emitter And Rear Cell Revenue (million) Forecast, by Application 2019 & 2032
- Table 47: Rest of Asia Pacific Passivated Emitter And Rear Cell Revenue (million) Forecast, by Application 2019 & 2032
Frequently Asked Questions
1. What is the projected Compound Annual Growth Rate (CAGR) of the Passivated Emitter And Rear Cell?
The projected CAGR is approximately XX%.
2. Which companies are prominent players in the Passivated Emitter And Rear Cell?
Key companies in the market include LONGi Green Energy Technology Co., Ltd., Tongwei Co., Ltd., Trina Solar Co., Ltd., JA Solar Technology Co., Ltd., Jinko SOLAR Co., Ltd., Csi New Energy Holding Co., Ltd., Shanghai Aiko Solar Energy Co., Ltd., Hanwha Solarone (Qidong) Co., Ltd..
3. What are the main segments of the Passivated Emitter And Rear Cell?
The market segments include Application, Types.
4. Can you provide details about the market size?
The market size is estimated to be USD XXX million as of 2022.
5. What are some drivers contributing to market growth?
N/A
6. What are the notable trends driving market growth?
N/A
7. Are there any restraints impacting market growth?
N/A
8. Can you provide examples of recent developments in the market?
N/A
9. What pricing options are available for accessing the report?
Pricing options include single-user, multi-user, and enterprise licenses priced at USD 4900.00, USD 7350.00, and USD 9800.00 respectively.
10. Is the market size provided in terms of value or volume?
The market size is provided in terms of value, measured in million.
11. Are there any specific market keywords associated with the report?
Yes, the market keyword associated with the report is "Passivated Emitter And Rear Cell," which aids in identifying and referencing the specific market segment covered.
12. How do I determine which pricing option suits my needs best?
The pricing options vary based on user requirements and access needs. Individual users may opt for single-user licenses, while businesses requiring broader access may choose multi-user or enterprise licenses for cost-effective access to the report.
13. Are there any additional resources or data provided in the Passivated Emitter And Rear Cell report?
While the report offers comprehensive insights, it's advisable to review the specific contents or supplementary materials provided to ascertain if additional resources or data are available.
14. How can I stay updated on further developments or reports in the Passivated Emitter And Rear Cell?
To stay informed about further developments, trends, and reports in the Passivated Emitter And Rear Cell, consider subscribing to industry newsletters, following relevant companies and organizations, or regularly checking reputable industry news sources and publications.
Methodology
Step 1 - Identification of Relevant Samples Size from Population Database


Step 2 - Approaches for Defining Global Market Size (Value, Volume* & Price*)

Note*: In applicable scenarios
Step 3 - Data Sources
Primary Research
- Web Analytics
- Survey Reports
- Research Institute
- Latest Research Reports
- Opinion Leaders
Secondary Research
- Annual Reports
- White Paper
- Latest Press Release
- Industry Association
- Paid Database
- Investor Presentations

Step 4 - Data Triangulation
Involves using different sources of information in order to increase the validity of a study
These sources are likely to be stakeholders in a program - participants, other researchers, program staff, other community members, and so on.
Then we put all data in single framework & apply various statistical tools to find out the dynamic on the market.
During the analysis stage, feedback from the stakeholder groups would be compared to determine areas of agreement as well as areas of divergence
