

Key Insights
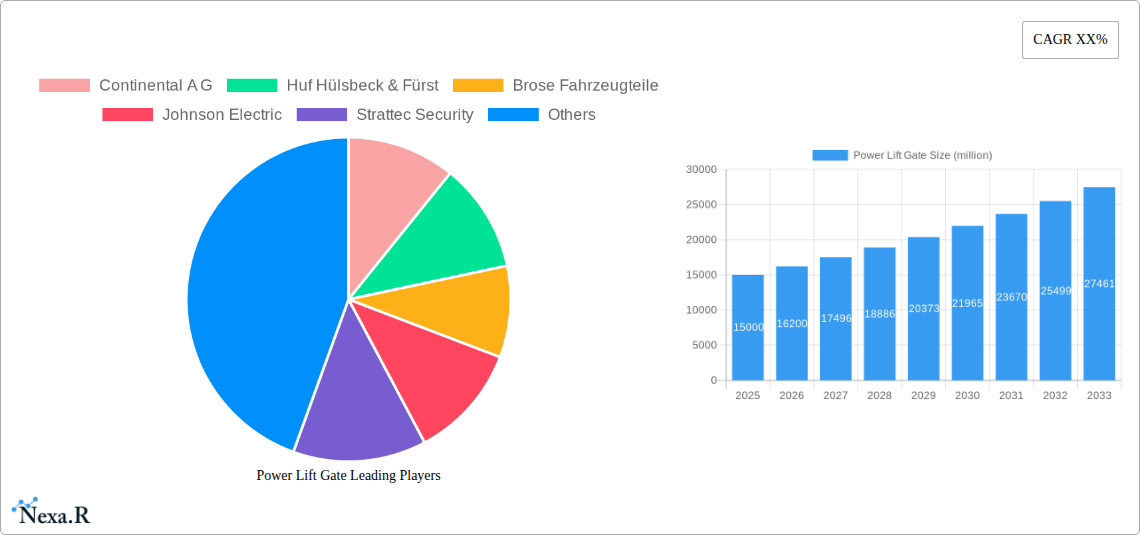
The global Power Lift Gate market is poised for significant expansion, projected to reach an estimated value of approximately USD 15,000 million by 2025, driven by a robust Compound Annual Growth Rate (CAGR) of around 8% during the forecast period of 2025-2033. This upward trajectory is primarily fueled by the increasing demand for enhanced convenience and premium features in vehicles, particularly within the passenger car segment. The integration of advanced technologies, such as hands-free operation, gesture control, and smart trunk opening systems, is further accelerating market adoption. Automakers are increasingly equipping their models with power lift gates as standard or optional features to cater to consumer preferences for ease of use and a sophisticated driving experience. The growing emphasis on vehicle electrification and the subsequent rise in electric vehicle (EV) sales also play a crucial role, as EVs often incorporate advanced technological features that align with the integration of power lift gates.
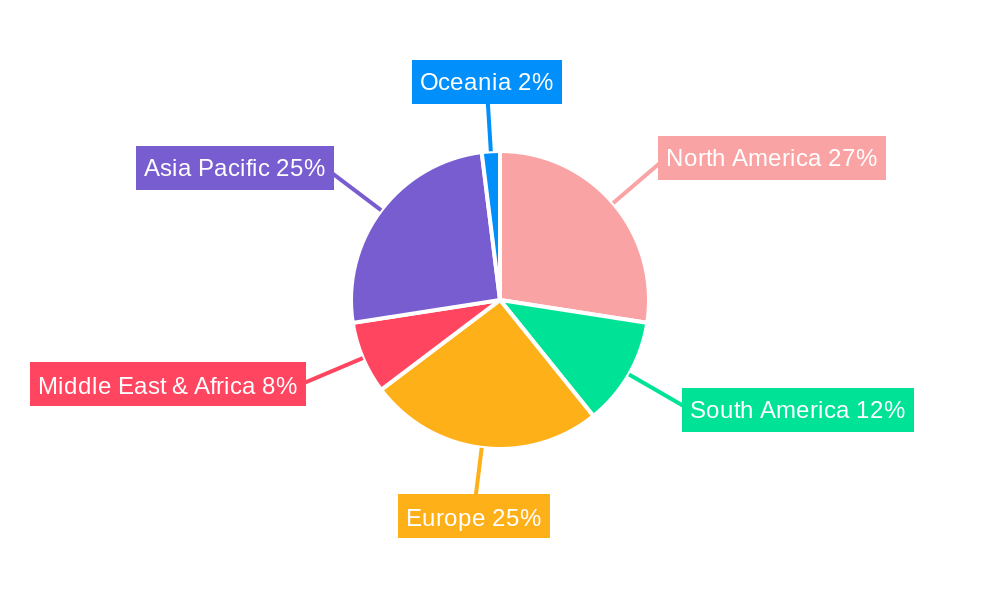
The market is broadly segmented into Metal Power Lift Gates and Composite Power Lift Gates, with metal variants currently holding a dominant share due to their established durability and cost-effectiveness. However, the composite segment is anticipated to witness faster growth owing to advancements in material science, leading to lighter, stronger, and more aesthetically integrated solutions. Geographically, the Asia Pacific region is expected to emerge as a key growth engine, propelled by the burgeoning automotive industry in countries like China and India, alongside a rapidly expanding middle class with a growing appetite for premium vehicle accessories. North America and Europe will continue to be substantial markets, driven by high vehicle penetration rates and consumer demand for innovative automotive technologies. Key players like Continental AG, Brose Fahrzeugteile, and Johnson Electric are at the forefront, investing heavily in research and development to introduce next-generation power lift gate systems that offer superior performance, safety, and user experience, further shaping the market landscape.
Global Power Lift Gate Market Report: 2019-2033
This comprehensive report provides an in-depth analysis of the global Power Lift Gate market, encompassing market dynamics, growth trends, regional dominance, product innovations, key drivers and challenges, emerging opportunities, growth accelerators, and a detailed outlook for the period of 2019–2033, with a base and estimated year of 2025. The report leverages extensive industry data and expert insights to deliver actionable intelligence for stakeholders across the automotive supply chain, including manufacturers, suppliers, and industry analysts.
Power Lift Gate Market Dynamics & Structure
The global Power Lift Gate market is characterized by a moderate to high concentration, with key players like Continental AG, Huf Hülsbeck & Fürst, Brose Fahrzeugteile, Johnson Electric, Strattec Security, and Woodbine Manufacturing holding significant market shares. Technological innovation is a primary driver, fueled by advancements in sensor technology, electric motor efficiency, and smart connectivity features, enabling hands-free operation and enhanced user convenience. Regulatory frameworks, particularly concerning vehicle safety and emissions, indirectly influence the adoption of power lift gates by encouraging the integration of advanced automotive technologies. Competitive product substitutes include traditional manual lift gates and tailgate spoilers, though the enhanced functionality and premium appeal of power lift gates are increasingly outweighing these alternatives for a growing consumer base. End-user demographics show a strong preference among SUV and premium vehicle owners, with increasing adoption in the mass-market passenger car segment driven by feature parity and consumer demand. Mergers and acquisition (M&A) trends are evident as larger automotive suppliers seek to consolidate their offerings and expand their technological portfolios, exemplified by recent strategic partnerships aimed at integrating smart tailgate solutions with vehicle infotainment systems. The market is projected to see a steady increase in M&A activities as companies strive for vertical integration and economies of scale.
- Market Concentration: Moderate to High, with a few dominant players.
- Technological Innovation Drivers: Sensor advancements, motor efficiency, smart connectivity, hands-free operation.
- Regulatory Frameworks: Indirect influence via safety and emission standards.
- Competitive Product Substitutes: Manual lift gates, tailgate spoilers.
- End-User Demographics: Strong preference in SUVs and premium vehicles, growing adoption in mass-market passenger cars.
- M&A Trends: Consolidation of offerings, portfolio expansion, integration of smart tailgate solutions.
Power Lift Gate Growth Trends & Insights
The global Power Lift Gate market is poised for robust growth, driven by escalating consumer demand for convenience and advanced automotive features, coupled with the increasing prevalence of SUVs and crossover vehicles. The market size is anticipated to expand significantly from approximately $4,500 million in 2025 to an estimated $8,800 million by 2033, exhibiting a Compound Annual Growth Rate (CAGR) of approximately 8.7% during the forecast period (2025–2033). Adoption rates for power lift gates have seen a substantial uplift, transitioning from a niche luxury feature to a mainstream option in a wide array of vehicle segments. This surge is attributed to automakers integrating these systems as standard or optional equipment to differentiate their offerings and cater to evolving consumer expectations. Technological disruptions, such as the integration of gesture control, voice activation, and proximity sensors, are further enhancing the user experience and driving market penetration. Consumer behavior shifts are also playing a crucial role; buyers are increasingly prioritizing comfort, ease of use, and the "wow" factor when making purchasing decisions, making power lift gates a compelling selling point. The historical period (2019–2024) witnessed steady growth, laying the groundwork for accelerated expansion in the coming years. Market penetration in developed regions is already substantial, with emerging economies presenting significant untapped potential. Innovations in lightweight materials for composite power lift gates are also contributing to improved vehicle efficiency, further bolstering adoption. The trend towards electrification of vehicle components overall creates a synergistic environment for the proliferation of power lift gates.
Dominant Regions, Countries, or Segments in Power Lift Gate
The Passenger Car segment, particularly within the Metal Power Lift Gate type, is currently the dominant force driving growth in the global Power Lift Gate market. This dominance is primarily attributed to the widespread popularity and high sales volumes of SUVs, crossovers, and premium sedans, which frequently feature power lift gates as standard or highly sought-after optional equipment. North America and Europe represent the leading regions due to their established automotive industries, high consumer disposable income, and a strong preference for feature-rich vehicles. In North America, the extensive adoption of SUVs and minivans, coupled with a consumer inclination towards convenience-driven technologies, fuels significant demand. The market size for power lift gates in the passenger car segment is estimated to be around $3,200 million in 2025.
Key drivers of this dominance include:
- High SUV and Crossover Penetration: These vehicle types inherently benefit from and often necessitate power lift gates due to their larger and heavier tailgates, enhancing user accessibility and reducing physical strain.
- Consumer Demand for Premium Features: In these mature markets, consumers expect advanced features like power lift gates, viewing them as essential for a modern and comfortable driving experience.
- Automaker Strategy: Manufacturers actively use power lift gates as a key differentiator and value-added feature to attract buyers in a competitive market.
- Technological Integration: The seamless integration of power lift gates with other in-car technologies, such as keyless entry and remote operation, further enhances their appeal.
While Composite Power Lift Gates are gaining traction due to their lightweight properties, contributing to fuel efficiency, the established manufacturing processes and cost-effectiveness of metal-based solutions currently position them as the market leader within the passenger car application. The market share for metal power lift gates in passenger cars is estimated at approximately 70% in 2025. The growth potential in the Commercial Vehicle segment, particularly for delivery vans and specialized utility vehicles, is substantial but is still in its nascent stages compared to the passenger car sector. However, advancements in electric commercial vehicles are expected to accelerate the adoption of power lift gate solutions in this segment over the forecast period.
Power Lift Gate Product Landscape
The Power Lift Gate product landscape is characterized by continuous innovation aimed at enhancing convenience, safety, and integration. Key product advancements include the development of hands-free operation systems utilizing proximity sensors and foot-kick gestures, allowing users to open and close the lift gate even when their hands are full. Advanced safety features, such as obstacle detection and anti-pinch mechanisms, are becoming standard, ensuring user protection. Furthermore, the integration of smart features, including programmable height settings, remote operation via smartphone apps, and compatibility with voice assistants, is transforming the user experience. Performance metrics are consistently improving with more efficient electric motors and robust actuation systems, leading to faster opening and closing times and increased load-bearing capacities. Unique selling propositions revolve around the seamless integration into the vehicle's existing electronic architecture and the enhancement of overall vehicle functionality.
Key Drivers, Barriers & Challenges in Power Lift Gate
The Power Lift Gate market is propelled by several key drivers, including the escalating consumer demand for convenience features, the growing popularity of SUVs and crossovers, and the trend towards automotive electrification. Technological advancements in sensor technology and automation further enhance functionality, while automakers' focus on differentiating their products fuels integration. The expanding middle class in emerging economies also presents a significant growth avenue.
- Technological Innovation: Advancements in sensors, motors, and smart connectivity.
- Consumer Demand: Preference for convenience and premium features.
- Vehicle Segment Growth: Popularity of SUVs and crossovers.
- Automotive Electrification: Synergistic trend with electric vehicle components.
- Emerging Markets: Expanding middle class and increasing vehicle ownership.
Key challenges and restraints include the relatively higher cost of power lift gate systems compared to manual alternatives, which can impact adoption in price-sensitive markets. Supply chain complexities and potential disruptions, particularly for specialized electronic components, pose a risk. Stringent regulatory requirements for automotive safety and electromagnetic compatibility can also add to development costs and timelines. Competitive pressures from lower-cost traditional lift gates and the ongoing development of alternative tailgate designs also present challenges.
- Cost of Implementation: Higher initial investment for manufacturers and consumers.
- Supply Chain Vulnerabilities: Dependence on specialized electronic components.
- Regulatory Hurdles: Compliance with safety and EMC standards.
- Competitive Landscape: Pressure from manual gates and alternative designs.
Emerging Opportunities in Power Lift Gate
Emerging opportunities in the Power Lift Gate sector lie in the integration of advanced AI-powered features, such as predictive opening based on user proximity and vehicle docking. The expansion of power lift gate technology into lighter-weight commercial vehicle segments, including delivery vans and last-mile logistics vehicles, presents a significant untapped market. Evolving consumer preferences for enhanced digital integration and smart home connectivity are also opening avenues for power lift gates to become part of a broader connected vehicle ecosystem, allowing for remote diagnostics and personalized settings. The development of more sustainable and energy-efficient actuation systems will also cater to the growing demand for eco-friendly automotive solutions.
Growth Accelerators in the Power Lift Gate Industry
Growth in the Power Lift Gate industry is significantly accelerated by strategic partnerships between automotive OEMs and specialized technology providers, fostering co-development and rapid integration of advanced features. Continuous investment in research and development by key players, focusing on cost reduction and performance enhancement, is making power lift gates more accessible across a wider range of vehicle models. The increasing emphasis on in-car user experience by automotive manufacturers, viewing sophisticated features as crucial for brand perception and customer loyalty, acts as a powerful catalyst. Furthermore, the growing trend of vehicle customization and the demand for premium aftermarket solutions are creating additional avenues for market expansion and revenue generation.
Key Players Shaping the Power Lift Gate Market
- Continental AG
- Huf Hülsbeck & Fürst
- Brose Fahrzeugteile
- Johnson Electric
- Strattec Security
- Woodbine Manufacturing
Notable Milestones in Power Lift Gate Sector
- 2019: Increased integration of hands-free foot-kick operation in premium SUVs.
- 2020: Advancements in sensor technology leading to more precise and responsive gesture control.
- 2021: Growing adoption of programmable height settings across various vehicle segments.
- 2022: Emergence of smart lift gates controllable via smartphone applications.
- 2023: Increased focus on lightweight composite materials for power lift gates to improve fuel efficiency.
- 2024: Enhanced integration of voice command functionality for lift gate operation.
In-Depth Power Lift Gate Market Outlook
The future outlook for the Power Lift Gate market is exceptionally promising, driven by an undeniable consumer appetite for convenience and sophisticated automotive technologies. The ongoing integration of advanced automation, coupled with the continuous rise in SUV and crossover sales, will further solidify its market position. Strategic collaborations between automotive manufacturers and component suppliers will continue to drive innovation and reduce production costs, making power lift gates more attainable for a broader consumer base. The industry is poised for sustained growth, with significant opportunities arising from the electrification of vehicles and the development of more intelligent and connected automotive interiors, ensuring power lift gates remain a key feature in the evolving automotive landscape.
Power Lift Gate Segmentation
-
1. Application
- 1.1. Passenger Car
- 1.2. Commercial Vehicle
-
2. Types
- 2.1. Metal Power Lift Gate
- 2.2. Composite Power Lift Gate
Power Lift Gate Segmentation By Geography
-
1. North America
- 1.1. United States
- 1.2. Canada
- 1.3. Mexico
-
2. South America
- 2.1. Brazil
- 2.2. Argentina
- 2.3. Rest of South America
-
3. Europe
- 3.1. United Kingdom
- 3.2. Germany
- 3.3. France
- 3.4. Italy
- 3.5. Spain
- 3.6. Russia
- 3.7. Benelux
- 3.8. Nordics
- 3.9. Rest of Europe
-
4. Middle East & Africa
- 4.1. Turkey
- 4.2. Israel
- 4.3. GCC
- 4.4. North Africa
- 4.5. South Africa
- 4.6. Rest of Middle East & Africa
-
5. Asia Pacific
- 5.1. China
- 5.2. India
- 5.3. Japan
- 5.4. South Korea
- 5.5. ASEAN
- 5.6. Oceania
- 5.7. Rest of Asia Pacific
Power Lift Gate REPORT HIGHLIGHTS
| Aspects | Details |
|---|---|
| Study Period | 2019-2033 |
| Base Year | 2024 |
| Estimated Year | 2025 |
| Forecast Period | 2025-2033 |
| Historical Period | 2019-2024 |
| Growth Rate | CAGR of XX% from 2019-2033 |
| Segmentation |
|
Table of Contents
- 1. Introduction
- 1.1. Research Scope
- 1.2. Market Segmentation
- 1.3. Research Methodology
- 1.4. Definitions and Assumptions
- 2. Executive Summary
- 2.1. Introduction
- 3. Market Dynamics
- 3.1. Introduction
- 3.2. Market Drivers
- 3.3. Market Restrains
- 3.4. Market Trends
- 4. Market Factor Analysis
- 4.1. Porters Five Forces
- 4.2. Supply/Value Chain
- 4.3. PESTEL analysis
- 4.4. Market Entropy
- 4.5. Patent/Trademark Analysis
- 5. Global Power Lift Gate Analysis, Insights and Forecast, 2019-2031
- 5.1. Market Analysis, Insights and Forecast - by Application
- 5.1.1. Passenger Car
- 5.1.2. Commercial Vehicle
- 5.2. Market Analysis, Insights and Forecast - by Types
- 5.2.1. Metal Power Lift Gate
- 5.2.2. Composite Power Lift Gate
- 5.3. Market Analysis, Insights and Forecast - by Region
- 5.3.1. North America
- 5.3.2. South America
- 5.3.3. Europe
- 5.3.4. Middle East & Africa
- 5.3.5. Asia Pacific
- 5.1. Market Analysis, Insights and Forecast - by Application
- 6. North America Power Lift Gate Analysis, Insights and Forecast, 2019-2031
- 6.1. Market Analysis, Insights and Forecast - by Application
- 6.1.1. Passenger Car
- 6.1.2. Commercial Vehicle
- 6.2. Market Analysis, Insights and Forecast - by Types
- 6.2.1. Metal Power Lift Gate
- 6.2.2. Composite Power Lift Gate
- 6.1. Market Analysis, Insights and Forecast - by Application
- 7. South America Power Lift Gate Analysis, Insights and Forecast, 2019-2031
- 7.1. Market Analysis, Insights and Forecast - by Application
- 7.1.1. Passenger Car
- 7.1.2. Commercial Vehicle
- 7.2. Market Analysis, Insights and Forecast - by Types
- 7.2.1. Metal Power Lift Gate
- 7.2.2. Composite Power Lift Gate
- 7.1. Market Analysis, Insights and Forecast - by Application
- 8. Europe Power Lift Gate Analysis, Insights and Forecast, 2019-2031
- 8.1. Market Analysis, Insights and Forecast - by Application
- 8.1.1. Passenger Car
- 8.1.2. Commercial Vehicle
- 8.2. Market Analysis, Insights and Forecast - by Types
- 8.2.1. Metal Power Lift Gate
- 8.2.2. Composite Power Lift Gate
- 8.1. Market Analysis, Insights and Forecast - by Application
- 9. Middle East & Africa Power Lift Gate Analysis, Insights and Forecast, 2019-2031
- 9.1. Market Analysis, Insights and Forecast - by Application
- 9.1.1. Passenger Car
- 9.1.2. Commercial Vehicle
- 9.2. Market Analysis, Insights and Forecast - by Types
- 9.2.1. Metal Power Lift Gate
- 9.2.2. Composite Power Lift Gate
- 9.1. Market Analysis, Insights and Forecast - by Application
- 10. Asia Pacific Power Lift Gate Analysis, Insights and Forecast, 2019-2031
- 10.1. Market Analysis, Insights and Forecast - by Application
- 10.1.1. Passenger Car
- 10.1.2. Commercial Vehicle
- 10.2. Market Analysis, Insights and Forecast - by Types
- 10.2.1. Metal Power Lift Gate
- 10.2.2. Composite Power Lift Gate
- 10.1. Market Analysis, Insights and Forecast - by Application
- 11. Competitive Analysis
- 11.1. Global Market Share Analysis 2024
- 11.2. Company Profiles
- 11.2.1 Continental A G
- 11.2.1.1. Overview
- 11.2.1.2. Products
- 11.2.1.3. SWOT Analysis
- 11.2.1.4. Recent Developments
- 11.2.1.5. Financials (Based on Availability)
- 11.2.2 Huf Hülsbeck & Fürst
- 11.2.2.1. Overview
- 11.2.2.2. Products
- 11.2.2.3. SWOT Analysis
- 11.2.2.4. Recent Developments
- 11.2.2.5. Financials (Based on Availability)
- 11.2.3 Brose Fahrzeugteile
- 11.2.3.1. Overview
- 11.2.3.2. Products
- 11.2.3.3. SWOT Analysis
- 11.2.3.4. Recent Developments
- 11.2.3.5. Financials (Based on Availability)
- 11.2.4 Johnson Electric
- 11.2.4.1. Overview
- 11.2.4.2. Products
- 11.2.4.3. SWOT Analysis
- 11.2.4.4. Recent Developments
- 11.2.4.5. Financials (Based on Availability)
- 11.2.5 Strattec Security
- 11.2.5.1. Overview
- 11.2.5.2. Products
- 11.2.5.3. SWOT Analysis
- 11.2.5.4. Recent Developments
- 11.2.5.5. Financials (Based on Availability)
- 11.2.6 Woodbine Manufacturing
- 11.2.6.1. Overview
- 11.2.6.2. Products
- 11.2.6.3. SWOT Analysis
- 11.2.6.4. Recent Developments
- 11.2.6.5. Financials (Based on Availability)
- 11.2.1 Continental A G
List of Figures
- Figure 1: Global Power Lift Gate Revenue Breakdown (million, %) by Region 2024 & 2032
- Figure 2: North America Power Lift Gate Revenue (million), by Application 2024 & 2032
- Figure 3: North America Power Lift Gate Revenue Share (%), by Application 2024 & 2032
- Figure 4: North America Power Lift Gate Revenue (million), by Types 2024 & 2032
- Figure 5: North America Power Lift Gate Revenue Share (%), by Types 2024 & 2032
- Figure 6: North America Power Lift Gate Revenue (million), by Country 2024 & 2032
- Figure 7: North America Power Lift Gate Revenue Share (%), by Country 2024 & 2032
- Figure 8: South America Power Lift Gate Revenue (million), by Application 2024 & 2032
- Figure 9: South America Power Lift Gate Revenue Share (%), by Application 2024 & 2032
- Figure 10: South America Power Lift Gate Revenue (million), by Types 2024 & 2032
- Figure 11: South America Power Lift Gate Revenue Share (%), by Types 2024 & 2032
- Figure 12: South America Power Lift Gate Revenue (million), by Country 2024 & 2032
- Figure 13: South America Power Lift Gate Revenue Share (%), by Country 2024 & 2032
- Figure 14: Europe Power Lift Gate Revenue (million), by Application 2024 & 2032
- Figure 15: Europe Power Lift Gate Revenue Share (%), by Application 2024 & 2032
- Figure 16: Europe Power Lift Gate Revenue (million), by Types 2024 & 2032
- Figure 17: Europe Power Lift Gate Revenue Share (%), by Types 2024 & 2032
- Figure 18: Europe Power Lift Gate Revenue (million), by Country 2024 & 2032
- Figure 19: Europe Power Lift Gate Revenue Share (%), by Country 2024 & 2032
- Figure 20: Middle East & Africa Power Lift Gate Revenue (million), by Application 2024 & 2032
- Figure 21: Middle East & Africa Power Lift Gate Revenue Share (%), by Application 2024 & 2032
- Figure 22: Middle East & Africa Power Lift Gate Revenue (million), by Types 2024 & 2032
- Figure 23: Middle East & Africa Power Lift Gate Revenue Share (%), by Types 2024 & 2032
- Figure 24: Middle East & Africa Power Lift Gate Revenue (million), by Country 2024 & 2032
- Figure 25: Middle East & Africa Power Lift Gate Revenue Share (%), by Country 2024 & 2032
- Figure 26: Asia Pacific Power Lift Gate Revenue (million), by Application 2024 & 2032
- Figure 27: Asia Pacific Power Lift Gate Revenue Share (%), by Application 2024 & 2032
- Figure 28: Asia Pacific Power Lift Gate Revenue (million), by Types 2024 & 2032
- Figure 29: Asia Pacific Power Lift Gate Revenue Share (%), by Types 2024 & 2032
- Figure 30: Asia Pacific Power Lift Gate Revenue (million), by Country 2024 & 2032
- Figure 31: Asia Pacific Power Lift Gate Revenue Share (%), by Country 2024 & 2032
List of Tables
- Table 1: Global Power Lift Gate Revenue million Forecast, by Region 2019 & 2032
- Table 2: Global Power Lift Gate Revenue million Forecast, by Application 2019 & 2032
- Table 3: Global Power Lift Gate Revenue million Forecast, by Types 2019 & 2032
- Table 4: Global Power Lift Gate Revenue million Forecast, by Region 2019 & 2032
- Table 5: Global Power Lift Gate Revenue million Forecast, by Application 2019 & 2032
- Table 6: Global Power Lift Gate Revenue million Forecast, by Types 2019 & 2032
- Table 7: Global Power Lift Gate Revenue million Forecast, by Country 2019 & 2032
- Table 8: United States Power Lift Gate Revenue (million) Forecast, by Application 2019 & 2032
- Table 9: Canada Power Lift Gate Revenue (million) Forecast, by Application 2019 & 2032
- Table 10: Mexico Power Lift Gate Revenue (million) Forecast, by Application 2019 & 2032
- Table 11: Global Power Lift Gate Revenue million Forecast, by Application 2019 & 2032
- Table 12: Global Power Lift Gate Revenue million Forecast, by Types 2019 & 2032
- Table 13: Global Power Lift Gate Revenue million Forecast, by Country 2019 & 2032
- Table 14: Brazil Power Lift Gate Revenue (million) Forecast, by Application 2019 & 2032
- Table 15: Argentina Power Lift Gate Revenue (million) Forecast, by Application 2019 & 2032
- Table 16: Rest of South America Power Lift Gate Revenue (million) Forecast, by Application 2019 & 2032
- Table 17: Global Power Lift Gate Revenue million Forecast, by Application 2019 & 2032
- Table 18: Global Power Lift Gate Revenue million Forecast, by Types 2019 & 2032
- Table 19: Global Power Lift Gate Revenue million Forecast, by Country 2019 & 2032
- Table 20: United Kingdom Power Lift Gate Revenue (million) Forecast, by Application 2019 & 2032
- Table 21: Germany Power Lift Gate Revenue (million) Forecast, by Application 2019 & 2032
- Table 22: France Power Lift Gate Revenue (million) Forecast, by Application 2019 & 2032
- Table 23: Italy Power Lift Gate Revenue (million) Forecast, by Application 2019 & 2032
- Table 24: Spain Power Lift Gate Revenue (million) Forecast, by Application 2019 & 2032
- Table 25: Russia Power Lift Gate Revenue (million) Forecast, by Application 2019 & 2032
- Table 26: Benelux Power Lift Gate Revenue (million) Forecast, by Application 2019 & 2032
- Table 27: Nordics Power Lift Gate Revenue (million) Forecast, by Application 2019 & 2032
- Table 28: Rest of Europe Power Lift Gate Revenue (million) Forecast, by Application 2019 & 2032
- Table 29: Global Power Lift Gate Revenue million Forecast, by Application 2019 & 2032
- Table 30: Global Power Lift Gate Revenue million Forecast, by Types 2019 & 2032
- Table 31: Global Power Lift Gate Revenue million Forecast, by Country 2019 & 2032
- Table 32: Turkey Power Lift Gate Revenue (million) Forecast, by Application 2019 & 2032
- Table 33: Israel Power Lift Gate Revenue (million) Forecast, by Application 2019 & 2032
- Table 34: GCC Power Lift Gate Revenue (million) Forecast, by Application 2019 & 2032
- Table 35: North Africa Power Lift Gate Revenue (million) Forecast, by Application 2019 & 2032
- Table 36: South Africa Power Lift Gate Revenue (million) Forecast, by Application 2019 & 2032
- Table 37: Rest of Middle East & Africa Power Lift Gate Revenue (million) Forecast, by Application 2019 & 2032
- Table 38: Global Power Lift Gate Revenue million Forecast, by Application 2019 & 2032
- Table 39: Global Power Lift Gate Revenue million Forecast, by Types 2019 & 2032
- Table 40: Global Power Lift Gate Revenue million Forecast, by Country 2019 & 2032
- Table 41: China Power Lift Gate Revenue (million) Forecast, by Application 2019 & 2032
- Table 42: India Power Lift Gate Revenue (million) Forecast, by Application 2019 & 2032
- Table 43: Japan Power Lift Gate Revenue (million) Forecast, by Application 2019 & 2032
- Table 44: South Korea Power Lift Gate Revenue (million) Forecast, by Application 2019 & 2032
- Table 45: ASEAN Power Lift Gate Revenue (million) Forecast, by Application 2019 & 2032
- Table 46: Oceania Power Lift Gate Revenue (million) Forecast, by Application 2019 & 2032
- Table 47: Rest of Asia Pacific Power Lift Gate Revenue (million) Forecast, by Application 2019 & 2032
Frequently Asked Questions
1. What is the projected Compound Annual Growth Rate (CAGR) of the Power Lift Gate?
The projected CAGR is approximately XX%.
2. Which companies are prominent players in the Power Lift Gate?
Key companies in the market include Continental A G, Huf Hülsbeck & Fürst, Brose Fahrzeugteile, Johnson Electric, Strattec Security, Woodbine Manufacturing.
3. What are the main segments of the Power Lift Gate?
The market segments include Application, Types.
4. Can you provide details about the market size?
The market size is estimated to be USD XXX million as of 2022.
5. What are some drivers contributing to market growth?
N/A
6. What are the notable trends driving market growth?
N/A
7. Are there any restraints impacting market growth?
N/A
8. Can you provide examples of recent developments in the market?
N/A
9. What pricing options are available for accessing the report?
Pricing options include single-user, multi-user, and enterprise licenses priced at USD 4900.00, USD 7350.00, and USD 9800.00 respectively.
10. Is the market size provided in terms of value or volume?
The market size is provided in terms of value, measured in million.
11. Are there any specific market keywords associated with the report?
Yes, the market keyword associated with the report is "Power Lift Gate," which aids in identifying and referencing the specific market segment covered.
12. How do I determine which pricing option suits my needs best?
The pricing options vary based on user requirements and access needs. Individual users may opt for single-user licenses, while businesses requiring broader access may choose multi-user or enterprise licenses for cost-effective access to the report.
13. Are there any additional resources or data provided in the Power Lift Gate report?
While the report offers comprehensive insights, it's advisable to review the specific contents or supplementary materials provided to ascertain if additional resources or data are available.
14. How can I stay updated on further developments or reports in the Power Lift Gate?
To stay informed about further developments, trends, and reports in the Power Lift Gate, consider subscribing to industry newsletters, following relevant companies and organizations, or regularly checking reputable industry news sources and publications.
Methodology
Step 1 - Identification of Relevant Samples Size from Population Database


Step 2 - Approaches for Defining Global Market Size (Value, Volume* & Price*)

Note*: In applicable scenarios
Step 3 - Data Sources
Primary Research
- Web Analytics
- Survey Reports
- Research Institute
- Latest Research Reports
- Opinion Leaders
Secondary Research
- Annual Reports
- White Paper
- Latest Press Release
- Industry Association
- Paid Database
- Investor Presentations

Step 4 - Data Triangulation
Involves using different sources of information in order to increase the validity of a study
These sources are likely to be stakeholders in a program - participants, other researchers, program staff, other community members, and so on.
Then we put all data in single framework & apply various statistical tools to find out the dynamic on the market.
During the analysis stage, feedback from the stakeholder groups would be compared to determine areas of agreement as well as areas of divergence
