

Key Insights
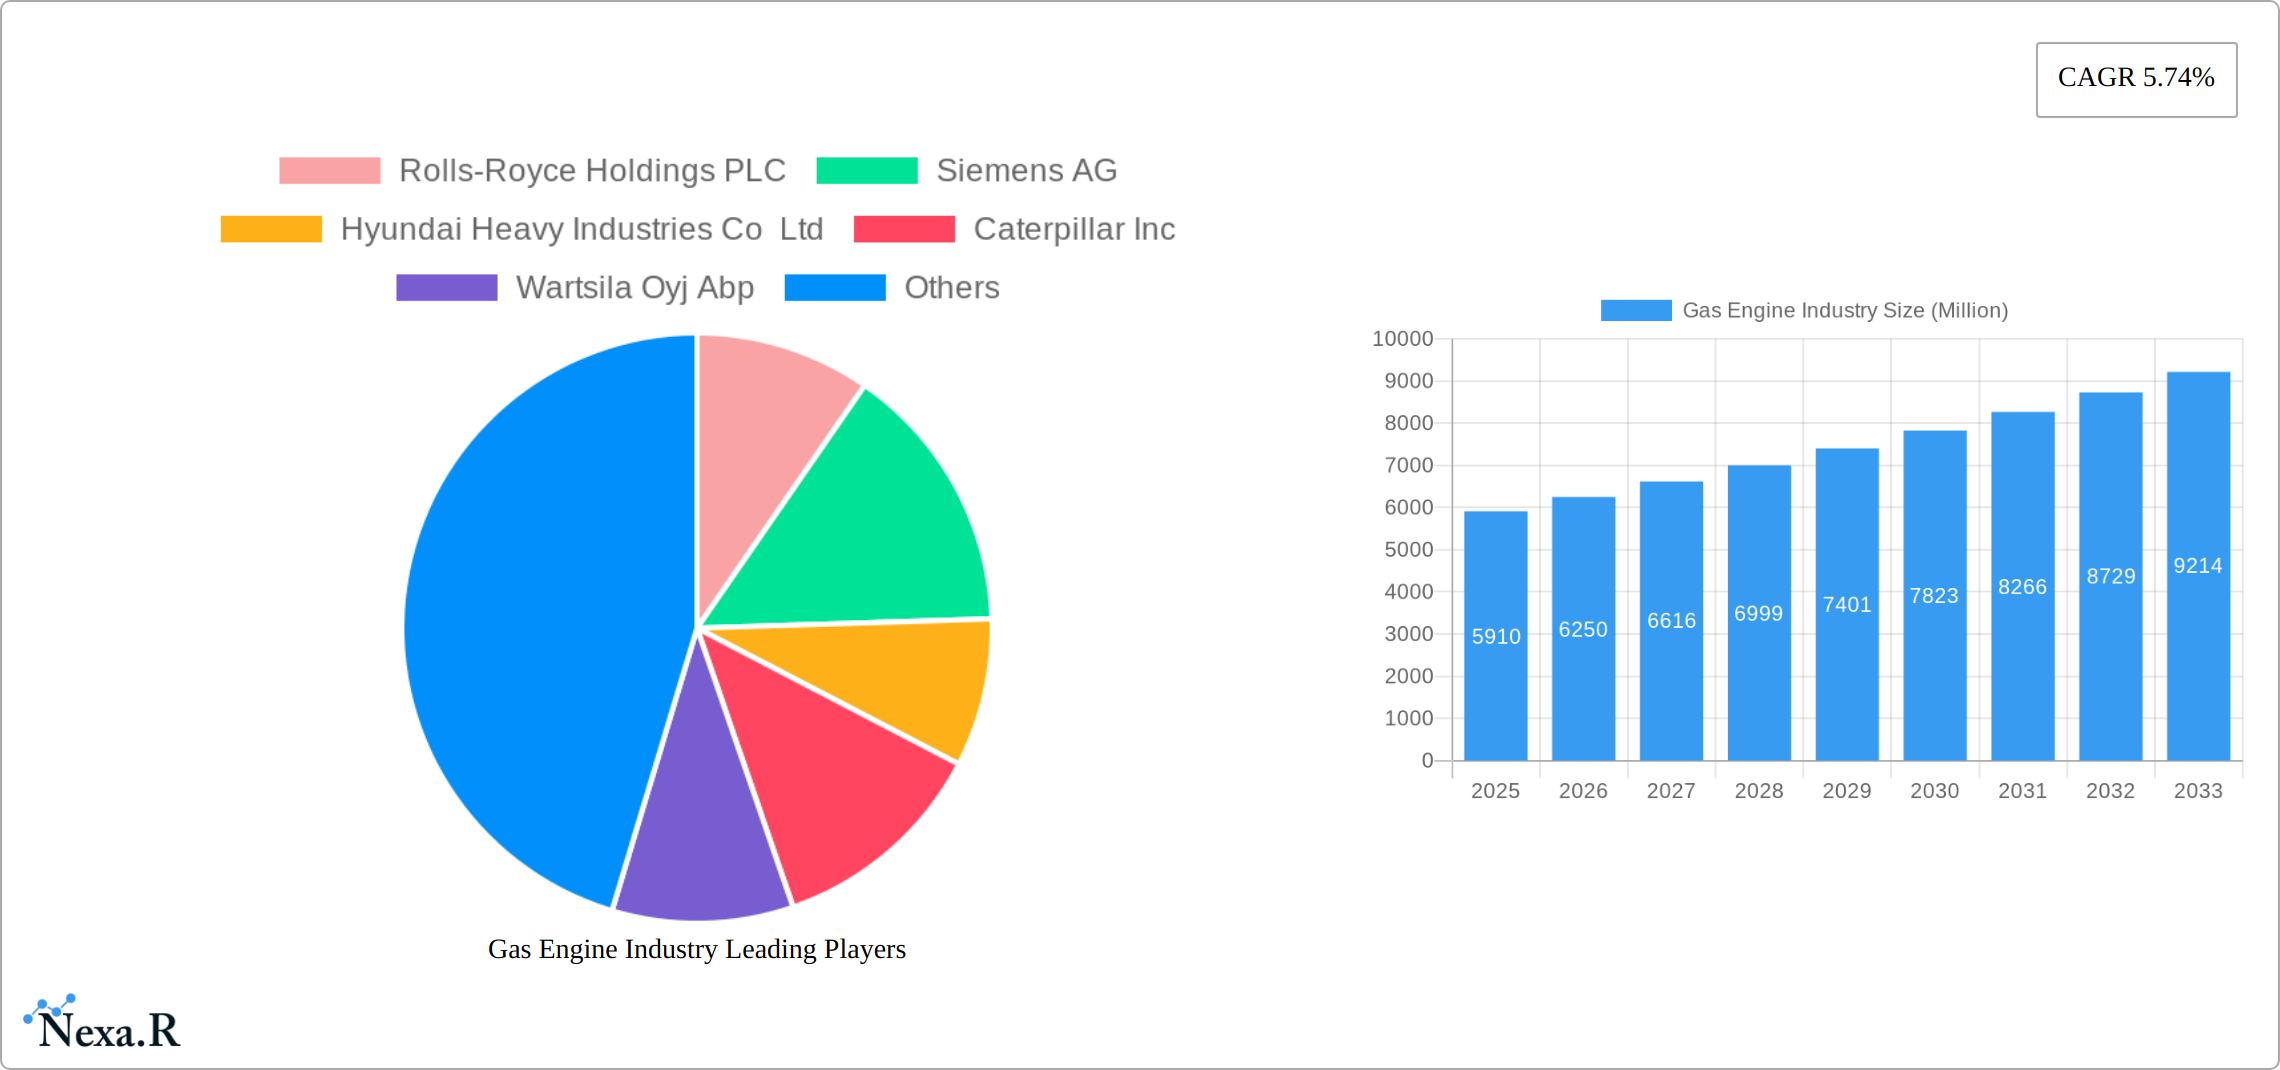
The global gas engine market, valued at $5.91 billion in 2025, is projected to experience robust growth, driven by increasing demand for reliable and efficient power generation solutions across various sectors. A Compound Annual Growth Rate (CAGR) of 5.74% from 2025 to 2033 signifies a significant expansion, fueled by several key factors. The power utilities sector remains a major driver, with a growing need for decentralized power generation and flexible capacity to meet fluctuating energy demands. The automotive sector's adoption of natural gas engines for heavy-duty vehicles, driven by emission regulations and fuel cost considerations, contributes significantly to market growth. Furthermore, the marine and industrial sectors are adopting gas engines for their efficiency and reduced environmental impact, expanding market opportunities. Technological advancements in fuel efficiency and emission control technologies are further propelling market expansion. While initial investment costs might act as a restraint for some sectors, the long-term operational cost savings and environmental benefits of gas engines outweigh these concerns, driving sustained market growth.
However, the market faces challenges. Fluctuations in natural gas prices can impact the overall cost-effectiveness of gas engines, influencing adoption rates. Additionally, the increasing competition from renewable energy sources, particularly in the power generation sector, presents a potential restraint. Despite these challenges, the market's diverse applications and ongoing technological improvements indicate a promising future. The market segmentation by fuel type (natural gas, hydrogen, others) and end-user (power utilities, automotive, marine, industrial, others) provides valuable insights into specific growth pockets. Regions such as North America, Europe, and Asia-Pacific are expected to lead market growth, driven by robust industrialization and infrastructural development. Companies like Rolls-Royce Holdings PLC, Siemens AG, and Caterpillar Inc. are key players shaping the market landscape through innovation and strategic partnerships. The continued focus on sustainable and cost-effective power solutions will solidify the gas engine market's long-term growth trajectory.
Gas Engine Industry Market Report: 2019-2033
This comprehensive report provides a detailed analysis of the global gas engine industry, covering market dynamics, growth trends, regional dominance, product landscape, key players, and future outlook. The study period spans 2019-2033, with 2025 as the base and estimated year. This report is crucial for industry professionals, investors, and strategists seeking to understand and capitalize on opportunities within this evolving sector. The report covers a parent market of Power Generation Equipment and a child market of Internal Combustion Engines. Market size is presented in Million units.
Gas Engine Industry Market Dynamics & Structure
The gas engine market is characterized by moderate concentration, with several major players holding significant market share. Technological innovation, driven by stricter emission regulations and the pursuit of higher efficiency, is a key driver. Regulatory frameworks, particularly those related to environmental protection, heavily influence market growth and product development. Competitive substitutes, such as fuel cells and electric motors, present challenges, while mergers and acquisitions (M&A) activities reshape the competitive landscape.
- Market Concentration: Moderately concentrated, with top 5 players holding approximately xx% of the market share in 2024.
- Technological Innovation: Focus on improving thermal efficiency, reducing emissions, and exploring alternative fuels like hydrogen.
- Regulatory Framework: Stringent emission standards drive the adoption of cleaner technologies.
- Competitive Substitutes: Growth of renewable energy sources and electric power generation poses a competitive threat.
- M&A Activity: xx M&A deals recorded in the past 5 years, indicating consolidation and strategic expansion.
- End-User Demographics: Power utilities remain the largest end-user segment, followed by marine and industrial applications.
Gas Engine Industry Growth Trends & Insights
The gas engine market demonstrated robust growth from 2019 to 2024, fueled by rising global energy demand and substantial infrastructure development in emerging economies. While the market is projected to continue its expansion from 2025 to 2033, the growth rate is anticipated to moderate compared to the previous period, primarily due to the increasing adoption of alternative energy sources. However, several key factors will continue to drive market evolution. Technological advancements such as enhanced thermal efficiency, the versatility of dual-fuel engines, and the integration of sophisticated digital technologies are poised to significantly impact the industry. Furthermore, a growing global emphasis on environmental sustainability and cleaner energy solutions is fostering demand for more efficient and eco-friendly gas engines. This shift in consumer behavior is a key driver of innovation and market growth.
- Market Size Evolution: The market size expanded significantly from xx million units in 2019 to xx million units in 2024 and is projected to reach xx million units by 2033, demonstrating consistent, albeit moderating, growth.
- CAGR (2025-2033): xx%
- Market Penetration: xx% penetration rate in key regions by 2033, indicating substantial market reach.
- Technological Disruptions: Advancements in fuel injection systems, turbocharging, and emission control technologies are not only driving growth but also enhancing the efficiency and environmental performance of gas engines.
- Consumer Behavior Shifts: The increasing demand for environmentally friendly energy solutions is a powerful catalyst for the development and adoption of cleaner and more sustainable gas engine technologies.
Dominant Regions, Countries, or Segments in Gas Engine Industry
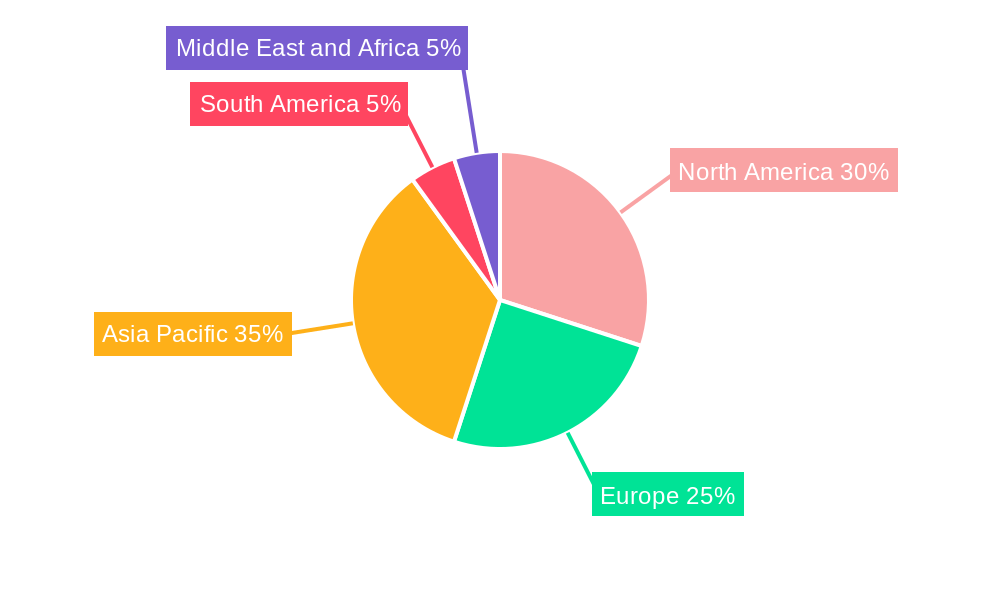
The Asia-Pacific region, particularly China and India, is expected to remain the dominant force in the gas engine market, driven by rapid industrialization, escalating energy needs, and supportive government policies fostering economic growth and infrastructure development. North America and Europe also maintain considerable market shares, although their growth rates are projected to be less pronounced than those in the Asia-Pacific region. Analyzing end-user segments reveals that power utilities constitute the largest market share, followed by the marine and industrial sectors. While natural gas remains the primary fuel source, there's a notable surge in interest and investment in hydrogen-fueled gas engines, reflecting a wider industry move towards cleaner energy solutions.
- Key Regional Drivers: Rapid industrialization in Asia-Pacific, robust infrastructure development in North America, and stringent environmental regulations in Europe all contribute to regional variations in market growth.
- Dominant End-User Segment: Power Utilities (xx% market share in 2024), highlighting the significant role of this sector in gas engine demand.
- Dominant Fuel Type: Natural Gas (xx% market share in 2024), although the market is witnessing a growing presence of hydrogen and other alternative fuels.
- Market Share & Growth Potential: Asia-Pacific maintains the largest market share with a projected CAGR of xx% during the forecast period, signifying its continuing dominance.
Gas Engine Industry Product Landscape
The gas engine market offers a diverse range of products tailored to specific applications and end-user requirements. Engine designs are increasingly focused on enhanced efficiency, reduced emissions, and improved durability. Key performance metrics include thermal efficiency, power output, emissions levels, and fuel consumption. Unique selling propositions often revolve around specific features such as advanced fuel injection systems, robust engine designs, and integrated control systems. Continuous advancements in materials science and manufacturing processes contribute to improved engine performance and reliability.
Key Drivers, Barriers & Challenges in Gas Engine Industry
Key Drivers:
- Increasing global energy demand.
- Growing industrialization and infrastructure development, particularly in emerging economies.
- Stringent emission regulations driving the adoption of cleaner technologies.
- Technological advancements leading to improved engine efficiency and reliability.
Key Challenges & Restraints:
- Fluctuations in natural gas prices can impact market growth.
- Competition from alternative energy sources such as renewable energy and fuel cells.
- Supply chain disruptions impacting the availability of crucial components.
- Regulatory hurdles related to emissions standards and environmental compliance.
Emerging Opportunities in Gas Engine Industry
- Growth in distributed generation and microgrids.
- Increasing demand for gas engines in data centers and other critical infrastructure applications.
- Expansion into developing markets with limited access to grid electricity.
- Development of hydrogen-fueled gas engines for decarbonization efforts.
Growth Accelerators in the Gas Engine Industry
Significant technological advancements in fuel injection, combustion optimization, and emission control systems are pivotal in propelling long-term growth. Strategic alliances and collaborations between engine manufacturers, fuel providers, and technology innovators are further accelerating market expansion by fostering innovation and streamlining the supply chain. Actively pursuing new markets with high growth potential and concentrating on specialized niche applications will also contribute to sustained industry expansion. These strategic approaches allow for targeted growth and market diversification.
Key Players Shaping the Gas Engine Industry Market
- Rolls-Royce Holdings PLC
- Siemens AG
- Hyundai Heavy Industries Co Ltd
- Caterpillar Inc
- Wartsila Oyj Abp
- Liebherr Group
- Cummins Inc
- General Electric Company
- Kawasaki Heavy Industries Ltd
- JFE Engineering Corporation
- Man SE
- Mitsubishi Heavy Industries Ltd
Notable Milestones in Gas Engine Industry Sector
- November 2022: Weichai Group's launch of a commercial natural gas engine boasting 54.16% base engine thermal efficiency represents a significant leap in engine technology.
- March 2023: ITP Aero's leadership of a consortium to develop a hydrogen-fueled commercial aircraft engine (USD 13 million project) underscores the growing investment in alternative fuel technologies within the broader engine sector.
In-Depth Gas Engine Industry Market Outlook
The gas engine market is poised for continued growth, albeit at a potentially moderated pace compared to previous years. Technological advancements, strategic partnerships, and expansion into new markets will be key drivers of future growth. The increasing focus on decarbonization and the development of hydrogen-fueled gas engines present significant opportunities for market players. Continued innovation and adaptation to evolving regulatory landscapes will be essential for success in this dynamic industry.
Gas Engine Industry Segmentation
-
1. End-User
- 1.1. Power Utilities
- 1.2. Automotive
- 1.3. Marine
- 1.4. Industrial
- 1.5. Others
-
2. Fuel Type
- 2.1. Natural Gas
- 2.2. Hydrogen
- 2.3. Other Fuel Types
Gas Engine Industry Segmentation By Geography
-
1. North America
- 1.1. United States
- 1.2. Canada
- 1.3. Rest of North America
-
2. Europe
- 2.1. Germany
- 2.2. France
- 2.3. United Kingdom
- 2.4. Rest of Europe
-
3. Asia Pacific
- 3.1. China
- 3.2. India
- 3.3. Japan
- 3.4. South Korea
- 3.5. Rest of Asia Pacific
-
4. South America
- 4.1. Brazil
- 4.2. Argentina
- 4.3. Rest of South America
-
5. Middle East and Africa
- 5.1. Saudi Arabia
- 5.2. United Arab Emirates
- 5.3. South Africa
- 5.4. Rest of Middle East and Africa
Gas Engine Industry REPORT HIGHLIGHTS
| Aspects | Details |
|---|---|
| Study Period | 2019-2033 |
| Base Year | 2024 |
| Estimated Year | 2025 |
| Forecast Period | 2025-2033 |
| Historical Period | 2019-2024 |
| Growth Rate | CAGR of 5.74% from 2019-2033 |
| Segmentation |
|
Table of Contents
- 1. Introduction
- 1.1. Research Scope
- 1.2. Market Segmentation
- 1.3. Research Methodology
- 1.4. Definitions and Assumptions
- 2. Executive Summary
- 2.1. Introduction
- 3. Market Dynamics
- 3.1. Introduction
- 3.2. Market Drivers
- 3.2.1. 4.; Increasing Supply and Consumption of Gas-based Systems in Various End-user Industry4.; Implementation of stricter emission regulations worldwide
- 3.3. Market Restrains
- 3.3.1. 4.; Growing Inclination towards Renewable Sources
- 3.4. Market Trends
- 3.4.1. Power Utilities Expected to Witness Significant Growth
- 4. Market Factor Analysis
- 4.1. Porters Five Forces
- 4.2. Supply/Value Chain
- 4.3. PESTEL analysis
- 4.4. Market Entropy
- 4.5. Patent/Trademark Analysis
- 5. Global Gas Engine Industry Analysis, Insights and Forecast, 2019-2031
- 5.1. Market Analysis, Insights and Forecast - by End-User
- 5.1.1. Power Utilities
- 5.1.2. Automotive
- 5.1.3. Marine
- 5.1.4. Industrial
- 5.1.5. Others
- 5.2. Market Analysis, Insights and Forecast - by Fuel Type
- 5.2.1. Natural Gas
- 5.2.2. Hydrogen
- 5.2.3. Other Fuel Types
- 5.3. Market Analysis, Insights and Forecast - by Region
- 5.3.1. North America
- 5.3.2. Europe
- 5.3.3. Asia Pacific
- 5.3.4. South America
- 5.3.5. Middle East and Africa
- 5.1. Market Analysis, Insights and Forecast - by End-User
- 6. North America Gas Engine Industry Analysis, Insights and Forecast, 2019-2031
- 6.1. Market Analysis, Insights and Forecast - by End-User
- 6.1.1. Power Utilities
- 6.1.2. Automotive
- 6.1.3. Marine
- 6.1.4. Industrial
- 6.1.5. Others
- 6.2. Market Analysis, Insights and Forecast - by Fuel Type
- 6.2.1. Natural Gas
- 6.2.2. Hydrogen
- 6.2.3. Other Fuel Types
- 6.1. Market Analysis, Insights and Forecast - by End-User
- 7. Europe Gas Engine Industry Analysis, Insights and Forecast, 2019-2031
- 7.1. Market Analysis, Insights and Forecast - by End-User
- 7.1.1. Power Utilities
- 7.1.2. Automotive
- 7.1.3. Marine
- 7.1.4. Industrial
- 7.1.5. Others
- 7.2. Market Analysis, Insights and Forecast - by Fuel Type
- 7.2.1. Natural Gas
- 7.2.2. Hydrogen
- 7.2.3. Other Fuel Types
- 7.1. Market Analysis, Insights and Forecast - by End-User
- 8. Asia Pacific Gas Engine Industry Analysis, Insights and Forecast, 2019-2031
- 8.1. Market Analysis, Insights and Forecast - by End-User
- 8.1.1. Power Utilities
- 8.1.2. Automotive
- 8.1.3. Marine
- 8.1.4. Industrial
- 8.1.5. Others
- 8.2. Market Analysis, Insights and Forecast - by Fuel Type
- 8.2.1. Natural Gas
- 8.2.2. Hydrogen
- 8.2.3. Other Fuel Types
- 8.1. Market Analysis, Insights and Forecast - by End-User
- 9. South America Gas Engine Industry Analysis, Insights and Forecast, 2019-2031
- 9.1. Market Analysis, Insights and Forecast - by End-User
- 9.1.1. Power Utilities
- 9.1.2. Automotive
- 9.1.3. Marine
- 9.1.4. Industrial
- 9.1.5. Others
- 9.2. Market Analysis, Insights and Forecast - by Fuel Type
- 9.2.1. Natural Gas
- 9.2.2. Hydrogen
- 9.2.3. Other Fuel Types
- 9.1. Market Analysis, Insights and Forecast - by End-User
- 10. Middle East and Africa Gas Engine Industry Analysis, Insights and Forecast, 2019-2031
- 10.1. Market Analysis, Insights and Forecast - by End-User
- 10.1.1. Power Utilities
- 10.1.2. Automotive
- 10.1.3. Marine
- 10.1.4. Industrial
- 10.1.5. Others
- 10.2. Market Analysis, Insights and Forecast - by Fuel Type
- 10.2.1. Natural Gas
- 10.2.2. Hydrogen
- 10.2.3. Other Fuel Types
- 10.1. Market Analysis, Insights and Forecast - by End-User
- 11. North America Gas Engine Industry Analysis, Insights and Forecast, 2019-2031
- 11.1. Market Analysis, Insights and Forecast - By Country/Sub-region
- 11.1.1 United States
- 11.1.2 Canada
- 11.1.3 Rest of North America
- 12. Europe Gas Engine Industry Analysis, Insights and Forecast, 2019-2031
- 12.1. Market Analysis, Insights and Forecast - By Country/Sub-region
- 12.1.1 Germany
- 12.1.2 France
- 12.1.3 United Kingdom
- 12.1.4 Rest of Europe
- 13. Asia Pacific Gas Engine Industry Analysis, Insights and Forecast, 2019-2031
- 13.1. Market Analysis, Insights and Forecast - By Country/Sub-region
- 13.1.1 China
- 13.1.2 India
- 13.1.3 Japan
- 13.1.4 South Korea
- 13.1.5 Rest of Asia Pacific
- 14. South America Gas Engine Industry Analysis, Insights and Forecast, 2019-2031
- 14.1. Market Analysis, Insights and Forecast - By Country/Sub-region
- 14.1.1 Brazil
- 14.1.2 Argentina
- 14.1.3 Rest of South America
- 15. Middle East and Africa Gas Engine Industry Analysis, Insights and Forecast, 2019-2031
- 15.1. Market Analysis, Insights and Forecast - By Country/Sub-region
- 15.1.1 Saudi Arabia
- 15.1.2 United Arab Emirates
- 15.1.3 South Africa
- 15.1.4 Rest of Middle East and Africa
- 16. Competitive Analysis
- 16.1. Global Market Share Analysis 2024
- 16.2. Company Profiles
- 16.2.1 Rolls-Royce Holdings PLC
- 16.2.1.1. Overview
- 16.2.1.2. Products
- 16.2.1.3. SWOT Analysis
- 16.2.1.4. Recent Developments
- 16.2.1.5. Financials (Based on Availability)
- 16.2.2 Siemens AG
- 16.2.2.1. Overview
- 16.2.2.2. Products
- 16.2.2.3. SWOT Analysis
- 16.2.2.4. Recent Developments
- 16.2.2.5. Financials (Based on Availability)
- 16.2.3 Hyundai Heavy Industries Co Ltd
- 16.2.3.1. Overview
- 16.2.3.2. Products
- 16.2.3.3. SWOT Analysis
- 16.2.3.4. Recent Developments
- 16.2.3.5. Financials (Based on Availability)
- 16.2.4 Caterpillar Inc
- 16.2.4.1. Overview
- 16.2.4.2. Products
- 16.2.4.3. SWOT Analysis
- 16.2.4.4. Recent Developments
- 16.2.4.5. Financials (Based on Availability)
- 16.2.5 Wartsila Oyj Abp
- 16.2.5.1. Overview
- 16.2.5.2. Products
- 16.2.5.3. SWOT Analysis
- 16.2.5.4. Recent Developments
- 16.2.5.5. Financials (Based on Availability)
- 16.2.6 Liebherr Group*List Not Exhaustive
- 16.2.6.1. Overview
- 16.2.6.2. Products
- 16.2.6.3. SWOT Analysis
- 16.2.6.4. Recent Developments
- 16.2.6.5. Financials (Based on Availability)
- 16.2.7 Cummins Inc
- 16.2.7.1. Overview
- 16.2.7.2. Products
- 16.2.7.3. SWOT Analysis
- 16.2.7.4. Recent Developments
- 16.2.7.5. Financials (Based on Availability)
- 16.2.8 General Electric Company
- 16.2.8.1. Overview
- 16.2.8.2. Products
- 16.2.8.3. SWOT Analysis
- 16.2.8.4. Recent Developments
- 16.2.8.5. Financials (Based on Availability)
- 16.2.9 Kawasaki Heavy Industries Ltd
- 16.2.9.1. Overview
- 16.2.9.2. Products
- 16.2.9.3. SWOT Analysis
- 16.2.9.4. Recent Developments
- 16.2.9.5. Financials (Based on Availability)
- 16.2.10 JFE Engineering Corporation
- 16.2.10.1. Overview
- 16.2.10.2. Products
- 16.2.10.3. SWOT Analysis
- 16.2.10.4. Recent Developments
- 16.2.10.5. Financials (Based on Availability)
- 16.2.11 Man SE
- 16.2.11.1. Overview
- 16.2.11.2. Products
- 16.2.11.3. SWOT Analysis
- 16.2.11.4. Recent Developments
- 16.2.11.5. Financials (Based on Availability)
- 16.2.12 Mitsubishi Heavy Industries Ltd
- 16.2.12.1. Overview
- 16.2.12.2. Products
- 16.2.12.3. SWOT Analysis
- 16.2.12.4. Recent Developments
- 16.2.12.5. Financials (Based on Availability)
- 16.2.1 Rolls-Royce Holdings PLC
List of Figures
- Figure 1: Global Gas Engine Industry Revenue Breakdown (Million, %) by Region 2024 & 2032
- Figure 2: Global Gas Engine Industry Volume Breakdown (K Unit, %) by Region 2024 & 2032
- Figure 3: North America Gas Engine Industry Revenue (Million), by Country 2024 & 2032
- Figure 4: North America Gas Engine Industry Volume (K Unit), by Country 2024 & 2032
- Figure 5: North America Gas Engine Industry Revenue Share (%), by Country 2024 & 2032
- Figure 6: North America Gas Engine Industry Volume Share (%), by Country 2024 & 2032
- Figure 7: Europe Gas Engine Industry Revenue (Million), by Country 2024 & 2032
- Figure 8: Europe Gas Engine Industry Volume (K Unit), by Country 2024 & 2032
- Figure 9: Europe Gas Engine Industry Revenue Share (%), by Country 2024 & 2032
- Figure 10: Europe Gas Engine Industry Volume Share (%), by Country 2024 & 2032
- Figure 11: Asia Pacific Gas Engine Industry Revenue (Million), by Country 2024 & 2032
- Figure 12: Asia Pacific Gas Engine Industry Volume (K Unit), by Country 2024 & 2032
- Figure 13: Asia Pacific Gas Engine Industry Revenue Share (%), by Country 2024 & 2032
- Figure 14: Asia Pacific Gas Engine Industry Volume Share (%), by Country 2024 & 2032
- Figure 15: South America Gas Engine Industry Revenue (Million), by Country 2024 & 2032
- Figure 16: South America Gas Engine Industry Volume (K Unit), by Country 2024 & 2032
- Figure 17: South America Gas Engine Industry Revenue Share (%), by Country 2024 & 2032
- Figure 18: South America Gas Engine Industry Volume Share (%), by Country 2024 & 2032
- Figure 19: Middle East and Africa Gas Engine Industry Revenue (Million), by Country 2024 & 2032
- Figure 20: Middle East and Africa Gas Engine Industry Volume (K Unit), by Country 2024 & 2032
- Figure 21: Middle East and Africa Gas Engine Industry Revenue Share (%), by Country 2024 & 2032
- Figure 22: Middle East and Africa Gas Engine Industry Volume Share (%), by Country 2024 & 2032
- Figure 23: North America Gas Engine Industry Revenue (Million), by End-User 2024 & 2032
- Figure 24: North America Gas Engine Industry Volume (K Unit), by End-User 2024 & 2032
- Figure 25: North America Gas Engine Industry Revenue Share (%), by End-User 2024 & 2032
- Figure 26: North America Gas Engine Industry Volume Share (%), by End-User 2024 & 2032
- Figure 27: North America Gas Engine Industry Revenue (Million), by Fuel Type 2024 & 2032
- Figure 28: North America Gas Engine Industry Volume (K Unit), by Fuel Type 2024 & 2032
- Figure 29: North America Gas Engine Industry Revenue Share (%), by Fuel Type 2024 & 2032
- Figure 30: North America Gas Engine Industry Volume Share (%), by Fuel Type 2024 & 2032
- Figure 31: North America Gas Engine Industry Revenue (Million), by Country 2024 & 2032
- Figure 32: North America Gas Engine Industry Volume (K Unit), by Country 2024 & 2032
- Figure 33: North America Gas Engine Industry Revenue Share (%), by Country 2024 & 2032
- Figure 34: North America Gas Engine Industry Volume Share (%), by Country 2024 & 2032
- Figure 35: Europe Gas Engine Industry Revenue (Million), by End-User 2024 & 2032
- Figure 36: Europe Gas Engine Industry Volume (K Unit), by End-User 2024 & 2032
- Figure 37: Europe Gas Engine Industry Revenue Share (%), by End-User 2024 & 2032
- Figure 38: Europe Gas Engine Industry Volume Share (%), by End-User 2024 & 2032
- Figure 39: Europe Gas Engine Industry Revenue (Million), by Fuel Type 2024 & 2032
- Figure 40: Europe Gas Engine Industry Volume (K Unit), by Fuel Type 2024 & 2032
- Figure 41: Europe Gas Engine Industry Revenue Share (%), by Fuel Type 2024 & 2032
- Figure 42: Europe Gas Engine Industry Volume Share (%), by Fuel Type 2024 & 2032
- Figure 43: Europe Gas Engine Industry Revenue (Million), by Country 2024 & 2032
- Figure 44: Europe Gas Engine Industry Volume (K Unit), by Country 2024 & 2032
- Figure 45: Europe Gas Engine Industry Revenue Share (%), by Country 2024 & 2032
- Figure 46: Europe Gas Engine Industry Volume Share (%), by Country 2024 & 2032
- Figure 47: Asia Pacific Gas Engine Industry Revenue (Million), by End-User 2024 & 2032
- Figure 48: Asia Pacific Gas Engine Industry Volume (K Unit), by End-User 2024 & 2032
- Figure 49: Asia Pacific Gas Engine Industry Revenue Share (%), by End-User 2024 & 2032
- Figure 50: Asia Pacific Gas Engine Industry Volume Share (%), by End-User 2024 & 2032
- Figure 51: Asia Pacific Gas Engine Industry Revenue (Million), by Fuel Type 2024 & 2032
- Figure 52: Asia Pacific Gas Engine Industry Volume (K Unit), by Fuel Type 2024 & 2032
- Figure 53: Asia Pacific Gas Engine Industry Revenue Share (%), by Fuel Type 2024 & 2032
- Figure 54: Asia Pacific Gas Engine Industry Volume Share (%), by Fuel Type 2024 & 2032
- Figure 55: Asia Pacific Gas Engine Industry Revenue (Million), by Country 2024 & 2032
- Figure 56: Asia Pacific Gas Engine Industry Volume (K Unit), by Country 2024 & 2032
- Figure 57: Asia Pacific Gas Engine Industry Revenue Share (%), by Country 2024 & 2032
- Figure 58: Asia Pacific Gas Engine Industry Volume Share (%), by Country 2024 & 2032
- Figure 59: South America Gas Engine Industry Revenue (Million), by End-User 2024 & 2032
- Figure 60: South America Gas Engine Industry Volume (K Unit), by End-User 2024 & 2032
- Figure 61: South America Gas Engine Industry Revenue Share (%), by End-User 2024 & 2032
- Figure 62: South America Gas Engine Industry Volume Share (%), by End-User 2024 & 2032
- Figure 63: South America Gas Engine Industry Revenue (Million), by Fuel Type 2024 & 2032
- Figure 64: South America Gas Engine Industry Volume (K Unit), by Fuel Type 2024 & 2032
- Figure 65: South America Gas Engine Industry Revenue Share (%), by Fuel Type 2024 & 2032
- Figure 66: South America Gas Engine Industry Volume Share (%), by Fuel Type 2024 & 2032
- Figure 67: South America Gas Engine Industry Revenue (Million), by Country 2024 & 2032
- Figure 68: South America Gas Engine Industry Volume (K Unit), by Country 2024 & 2032
- Figure 69: South America Gas Engine Industry Revenue Share (%), by Country 2024 & 2032
- Figure 70: South America Gas Engine Industry Volume Share (%), by Country 2024 & 2032
- Figure 71: Middle East and Africa Gas Engine Industry Revenue (Million), by End-User 2024 & 2032
- Figure 72: Middle East and Africa Gas Engine Industry Volume (K Unit), by End-User 2024 & 2032
- Figure 73: Middle East and Africa Gas Engine Industry Revenue Share (%), by End-User 2024 & 2032
- Figure 74: Middle East and Africa Gas Engine Industry Volume Share (%), by End-User 2024 & 2032
- Figure 75: Middle East and Africa Gas Engine Industry Revenue (Million), by Fuel Type 2024 & 2032
- Figure 76: Middle East and Africa Gas Engine Industry Volume (K Unit), by Fuel Type 2024 & 2032
- Figure 77: Middle East and Africa Gas Engine Industry Revenue Share (%), by Fuel Type 2024 & 2032
- Figure 78: Middle East and Africa Gas Engine Industry Volume Share (%), by Fuel Type 2024 & 2032
- Figure 79: Middle East and Africa Gas Engine Industry Revenue (Million), by Country 2024 & 2032
- Figure 80: Middle East and Africa Gas Engine Industry Volume (K Unit), by Country 2024 & 2032
- Figure 81: Middle East and Africa Gas Engine Industry Revenue Share (%), by Country 2024 & 2032
- Figure 82: Middle East and Africa Gas Engine Industry Volume Share (%), by Country 2024 & 2032
List of Tables
- Table 1: Global Gas Engine Industry Revenue Million Forecast, by Region 2019 & 2032
- Table 2: Global Gas Engine Industry Volume K Unit Forecast, by Region 2019 & 2032
- Table 3: Global Gas Engine Industry Revenue Million Forecast, by End-User 2019 & 2032
- Table 4: Global Gas Engine Industry Volume K Unit Forecast, by End-User 2019 & 2032
- Table 5: Global Gas Engine Industry Revenue Million Forecast, by Fuel Type 2019 & 2032
- Table 6: Global Gas Engine Industry Volume K Unit Forecast, by Fuel Type 2019 & 2032
- Table 7: Global Gas Engine Industry Revenue Million Forecast, by Region 2019 & 2032
- Table 8: Global Gas Engine Industry Volume K Unit Forecast, by Region 2019 & 2032
- Table 9: Global Gas Engine Industry Revenue Million Forecast, by Country 2019 & 2032
- Table 10: Global Gas Engine Industry Volume K Unit Forecast, by Country 2019 & 2032
- Table 11: United States Gas Engine Industry Revenue (Million) Forecast, by Application 2019 & 2032
- Table 12: United States Gas Engine Industry Volume (K Unit) Forecast, by Application 2019 & 2032
- Table 13: Canada Gas Engine Industry Revenue (Million) Forecast, by Application 2019 & 2032
- Table 14: Canada Gas Engine Industry Volume (K Unit) Forecast, by Application 2019 & 2032
- Table 15: Rest of North America Gas Engine Industry Revenue (Million) Forecast, by Application 2019 & 2032
- Table 16: Rest of North America Gas Engine Industry Volume (K Unit) Forecast, by Application 2019 & 2032
- Table 17: Global Gas Engine Industry Revenue Million Forecast, by Country 2019 & 2032
- Table 18: Global Gas Engine Industry Volume K Unit Forecast, by Country 2019 & 2032
- Table 19: Germany Gas Engine Industry Revenue (Million) Forecast, by Application 2019 & 2032
- Table 20: Germany Gas Engine Industry Volume (K Unit) Forecast, by Application 2019 & 2032
- Table 21: France Gas Engine Industry Revenue (Million) Forecast, by Application 2019 & 2032
- Table 22: France Gas Engine Industry Volume (K Unit) Forecast, by Application 2019 & 2032
- Table 23: United Kingdom Gas Engine Industry Revenue (Million) Forecast, by Application 2019 & 2032
- Table 24: United Kingdom Gas Engine Industry Volume (K Unit) Forecast, by Application 2019 & 2032
- Table 25: Rest of Europe Gas Engine Industry Revenue (Million) Forecast, by Application 2019 & 2032
- Table 26: Rest of Europe Gas Engine Industry Volume (K Unit) Forecast, by Application 2019 & 2032
- Table 27: Global Gas Engine Industry Revenue Million Forecast, by Country 2019 & 2032
- Table 28: Global Gas Engine Industry Volume K Unit Forecast, by Country 2019 & 2032
- Table 29: China Gas Engine Industry Revenue (Million) Forecast, by Application 2019 & 2032
- Table 30: China Gas Engine Industry Volume (K Unit) Forecast, by Application 2019 & 2032
- Table 31: India Gas Engine Industry Revenue (Million) Forecast, by Application 2019 & 2032
- Table 32: India Gas Engine Industry Volume (K Unit) Forecast, by Application 2019 & 2032
- Table 33: Japan Gas Engine Industry Revenue (Million) Forecast, by Application 2019 & 2032
- Table 34: Japan Gas Engine Industry Volume (K Unit) Forecast, by Application 2019 & 2032
- Table 35: South Korea Gas Engine Industry Revenue (Million) Forecast, by Application 2019 & 2032
- Table 36: South Korea Gas Engine Industry Volume (K Unit) Forecast, by Application 2019 & 2032
- Table 37: Rest of Asia Pacific Gas Engine Industry Revenue (Million) Forecast, by Application 2019 & 2032
- Table 38: Rest of Asia Pacific Gas Engine Industry Volume (K Unit) Forecast, by Application 2019 & 2032
- Table 39: Global Gas Engine Industry Revenue Million Forecast, by Country 2019 & 2032
- Table 40: Global Gas Engine Industry Volume K Unit Forecast, by Country 2019 & 2032
- Table 41: Brazil Gas Engine Industry Revenue (Million) Forecast, by Application 2019 & 2032
- Table 42: Brazil Gas Engine Industry Volume (K Unit) Forecast, by Application 2019 & 2032
- Table 43: Argentina Gas Engine Industry Revenue (Million) Forecast, by Application 2019 & 2032
- Table 44: Argentina Gas Engine Industry Volume (K Unit) Forecast, by Application 2019 & 2032
- Table 45: Rest of South America Gas Engine Industry Revenue (Million) Forecast, by Application 2019 & 2032
- Table 46: Rest of South America Gas Engine Industry Volume (K Unit) Forecast, by Application 2019 & 2032
- Table 47: Global Gas Engine Industry Revenue Million Forecast, by Country 2019 & 2032
- Table 48: Global Gas Engine Industry Volume K Unit Forecast, by Country 2019 & 2032
- Table 49: Saudi Arabia Gas Engine Industry Revenue (Million) Forecast, by Application 2019 & 2032
- Table 50: Saudi Arabia Gas Engine Industry Volume (K Unit) Forecast, by Application 2019 & 2032
- Table 51: United Arab Emirates Gas Engine Industry Revenue (Million) Forecast, by Application 2019 & 2032
- Table 52: United Arab Emirates Gas Engine Industry Volume (K Unit) Forecast, by Application 2019 & 2032
- Table 53: South Africa Gas Engine Industry Revenue (Million) Forecast, by Application 2019 & 2032
- Table 54: South Africa Gas Engine Industry Volume (K Unit) Forecast, by Application 2019 & 2032
- Table 55: Rest of Middle East and Africa Gas Engine Industry Revenue (Million) Forecast, by Application 2019 & 2032
- Table 56: Rest of Middle East and Africa Gas Engine Industry Volume (K Unit) Forecast, by Application 2019 & 2032
- Table 57: Global Gas Engine Industry Revenue Million Forecast, by End-User 2019 & 2032
- Table 58: Global Gas Engine Industry Volume K Unit Forecast, by End-User 2019 & 2032
- Table 59: Global Gas Engine Industry Revenue Million Forecast, by Fuel Type 2019 & 2032
- Table 60: Global Gas Engine Industry Volume K Unit Forecast, by Fuel Type 2019 & 2032
- Table 61: Global Gas Engine Industry Revenue Million Forecast, by Country 2019 & 2032
- Table 62: Global Gas Engine Industry Volume K Unit Forecast, by Country 2019 & 2032
- Table 63: United States Gas Engine Industry Revenue (Million) Forecast, by Application 2019 & 2032
- Table 64: United States Gas Engine Industry Volume (K Unit) Forecast, by Application 2019 & 2032
- Table 65: Canada Gas Engine Industry Revenue (Million) Forecast, by Application 2019 & 2032
- Table 66: Canada Gas Engine Industry Volume (K Unit) Forecast, by Application 2019 & 2032
- Table 67: Rest of North America Gas Engine Industry Revenue (Million) Forecast, by Application 2019 & 2032
- Table 68: Rest of North America Gas Engine Industry Volume (K Unit) Forecast, by Application 2019 & 2032
- Table 69: Global Gas Engine Industry Revenue Million Forecast, by End-User 2019 & 2032
- Table 70: Global Gas Engine Industry Volume K Unit Forecast, by End-User 2019 & 2032
- Table 71: Global Gas Engine Industry Revenue Million Forecast, by Fuel Type 2019 & 2032
- Table 72: Global Gas Engine Industry Volume K Unit Forecast, by Fuel Type 2019 & 2032
- Table 73: Global Gas Engine Industry Revenue Million Forecast, by Country 2019 & 2032
- Table 74: Global Gas Engine Industry Volume K Unit Forecast, by Country 2019 & 2032
- Table 75: Germany Gas Engine Industry Revenue (Million) Forecast, by Application 2019 & 2032
- Table 76: Germany Gas Engine Industry Volume (K Unit) Forecast, by Application 2019 & 2032
- Table 77: France Gas Engine Industry Revenue (Million) Forecast, by Application 2019 & 2032
- Table 78: France Gas Engine Industry Volume (K Unit) Forecast, by Application 2019 & 2032
- Table 79: United Kingdom Gas Engine Industry Revenue (Million) Forecast, by Application 2019 & 2032
- Table 80: United Kingdom Gas Engine Industry Volume (K Unit) Forecast, by Application 2019 & 2032
- Table 81: Rest of Europe Gas Engine Industry Revenue (Million) Forecast, by Application 2019 & 2032
- Table 82: Rest of Europe Gas Engine Industry Volume (K Unit) Forecast, by Application 2019 & 2032
- Table 83: Global Gas Engine Industry Revenue Million Forecast, by End-User 2019 & 2032
- Table 84: Global Gas Engine Industry Volume K Unit Forecast, by End-User 2019 & 2032
- Table 85: Global Gas Engine Industry Revenue Million Forecast, by Fuel Type 2019 & 2032
- Table 86: Global Gas Engine Industry Volume K Unit Forecast, by Fuel Type 2019 & 2032
- Table 87: Global Gas Engine Industry Revenue Million Forecast, by Country 2019 & 2032
- Table 88: Global Gas Engine Industry Volume K Unit Forecast, by Country 2019 & 2032
- Table 89: China Gas Engine Industry Revenue (Million) Forecast, by Application 2019 & 2032
- Table 90: China Gas Engine Industry Volume (K Unit) Forecast, by Application 2019 & 2032
- Table 91: India Gas Engine Industry Revenue (Million) Forecast, by Application 2019 & 2032
- Table 92: India Gas Engine Industry Volume (K Unit) Forecast, by Application 2019 & 2032
- Table 93: Japan Gas Engine Industry Revenue (Million) Forecast, by Application 2019 & 2032
- Table 94: Japan Gas Engine Industry Volume (K Unit) Forecast, by Application 2019 & 2032
- Table 95: South Korea Gas Engine Industry Revenue (Million) Forecast, by Application 2019 & 2032
- Table 96: South Korea Gas Engine Industry Volume (K Unit) Forecast, by Application 2019 & 2032
- Table 97: Rest of Asia Pacific Gas Engine Industry Revenue (Million) Forecast, by Application 2019 & 2032
- Table 98: Rest of Asia Pacific Gas Engine Industry Volume (K Unit) Forecast, by Application 2019 & 2032
- Table 99: Global Gas Engine Industry Revenue Million Forecast, by End-User 2019 & 2032
- Table 100: Global Gas Engine Industry Volume K Unit Forecast, by End-User 2019 & 2032
- Table 101: Global Gas Engine Industry Revenue Million Forecast, by Fuel Type 2019 & 2032
- Table 102: Global Gas Engine Industry Volume K Unit Forecast, by Fuel Type 2019 & 2032
- Table 103: Global Gas Engine Industry Revenue Million Forecast, by Country 2019 & 2032
- Table 104: Global Gas Engine Industry Volume K Unit Forecast, by Country 2019 & 2032
- Table 105: Brazil Gas Engine Industry Revenue (Million) Forecast, by Application 2019 & 2032
- Table 106: Brazil Gas Engine Industry Volume (K Unit) Forecast, by Application 2019 & 2032
- Table 107: Argentina Gas Engine Industry Revenue (Million) Forecast, by Application 2019 & 2032
- Table 108: Argentina Gas Engine Industry Volume (K Unit) Forecast, by Application 2019 & 2032
- Table 109: Rest of South America Gas Engine Industry Revenue (Million) Forecast, by Application 2019 & 2032
- Table 110: Rest of South America Gas Engine Industry Volume (K Unit) Forecast, by Application 2019 & 2032
- Table 111: Global Gas Engine Industry Revenue Million Forecast, by End-User 2019 & 2032
- Table 112: Global Gas Engine Industry Volume K Unit Forecast, by End-User 2019 & 2032
- Table 113: Global Gas Engine Industry Revenue Million Forecast, by Fuel Type 2019 & 2032
- Table 114: Global Gas Engine Industry Volume K Unit Forecast, by Fuel Type 2019 & 2032
- Table 115: Global Gas Engine Industry Revenue Million Forecast, by Country 2019 & 2032
- Table 116: Global Gas Engine Industry Volume K Unit Forecast, by Country 2019 & 2032
- Table 117: Saudi Arabia Gas Engine Industry Revenue (Million) Forecast, by Application 2019 & 2032
- Table 118: Saudi Arabia Gas Engine Industry Volume (K Unit) Forecast, by Application 2019 & 2032
- Table 119: United Arab Emirates Gas Engine Industry Revenue (Million) Forecast, by Application 2019 & 2032
- Table 120: United Arab Emirates Gas Engine Industry Volume (K Unit) Forecast, by Application 2019 & 2032
- Table 121: South Africa Gas Engine Industry Revenue (Million) Forecast, by Application 2019 & 2032
- Table 122: South Africa Gas Engine Industry Volume (K Unit) Forecast, by Application 2019 & 2032
- Table 123: Rest of Middle East and Africa Gas Engine Industry Revenue (Million) Forecast, by Application 2019 & 2032
- Table 124: Rest of Middle East and Africa Gas Engine Industry Volume (K Unit) Forecast, by Application 2019 & 2032
Frequently Asked Questions
1. What is the projected Compound Annual Growth Rate (CAGR) of the Gas Engine Industry?
The projected CAGR is approximately 5.74%.
2. Which companies are prominent players in the Gas Engine Industry?
Key companies in the market include Rolls-Royce Holdings PLC, Siemens AG, Hyundai Heavy Industries Co Ltd, Caterpillar Inc, Wartsila Oyj Abp, Liebherr Group*List Not Exhaustive, Cummins Inc, General Electric Company, Kawasaki Heavy Industries Ltd, JFE Engineering Corporation, Man SE, Mitsubishi Heavy Industries Ltd.
3. What are the main segments of the Gas Engine Industry?
The market segments include End-User, Fuel Type.
4. Can you provide details about the market size?
The market size is estimated to be USD 5.91 Million as of 2022.
5. What are some drivers contributing to market growth?
4.; Increasing Supply and Consumption of Gas-based Systems in Various End-user Industry4.; Implementation of stricter emission regulations worldwide.
6. What are the notable trends driving market growth?
Power Utilities Expected to Witness Significant Growth.
7. Are there any restraints impacting market growth?
4.; Growing Inclination towards Renewable Sources.
8. Can you provide examples of recent developments in the market?
In March 2023, ITP Aero, a Spanish aircraft engine company, has announced that it is leading a national consortium to test and develop the first hydrogen-fueled commercial aircraft engine developed locally. As part of the Spanish Ministry of Science agency's Aeronautical Technology Plan, managed by CDTI, the Spanish Center for Technological Development and Innovation, the USD 13 million Cryogenics, Fuel Cells and Hydrogen Combustion in Air Transport project is co-funded by European Union Next Gen strategic investment funding.
9. What pricing options are available for accessing the report?
Pricing options include single-user, multi-user, and enterprise licenses priced at USD 4750, USD 5250, and USD 8750 respectively.
10. Is the market size provided in terms of value or volume?
The market size is provided in terms of value, measured in Million and volume, measured in K Unit.
11. Are there any specific market keywords associated with the report?
Yes, the market keyword associated with the report is "Gas Engine Industry," which aids in identifying and referencing the specific market segment covered.
12. How do I determine which pricing option suits my needs best?
The pricing options vary based on user requirements and access needs. Individual users may opt for single-user licenses, while businesses requiring broader access may choose multi-user or enterprise licenses for cost-effective access to the report.
13. Are there any additional resources or data provided in the Gas Engine Industry report?
While the report offers comprehensive insights, it's advisable to review the specific contents or supplementary materials provided to ascertain if additional resources or data are available.
14. How can I stay updated on further developments or reports in the Gas Engine Industry?
To stay informed about further developments, trends, and reports in the Gas Engine Industry, consider subscribing to industry newsletters, following relevant companies and organizations, or regularly checking reputable industry news sources and publications.
Methodology
Step 1 - Identification of Relevant Samples Size from Population Database


Step 2 - Approaches for Defining Global Market Size (Value, Volume* & Price*)

Note*: In applicable scenarios
Step 3 - Data Sources
Primary Research
- Web Analytics
- Survey Reports
- Research Institute
- Latest Research Reports
- Opinion Leaders
Secondary Research
- Annual Reports
- White Paper
- Latest Press Release
- Industry Association
- Paid Database
- Investor Presentations

Step 4 - Data Triangulation
Involves using different sources of information in order to increase the validity of a study
These sources are likely to be stakeholders in a program - participants, other researchers, program staff, other community members, and so on.
Then we put all data in single framework & apply various statistical tools to find out the dynamic on the market.
During the analysis stage, feedback from the stakeholder groups would be compared to determine areas of agreement as well as areas of divergence
