

Key Insights
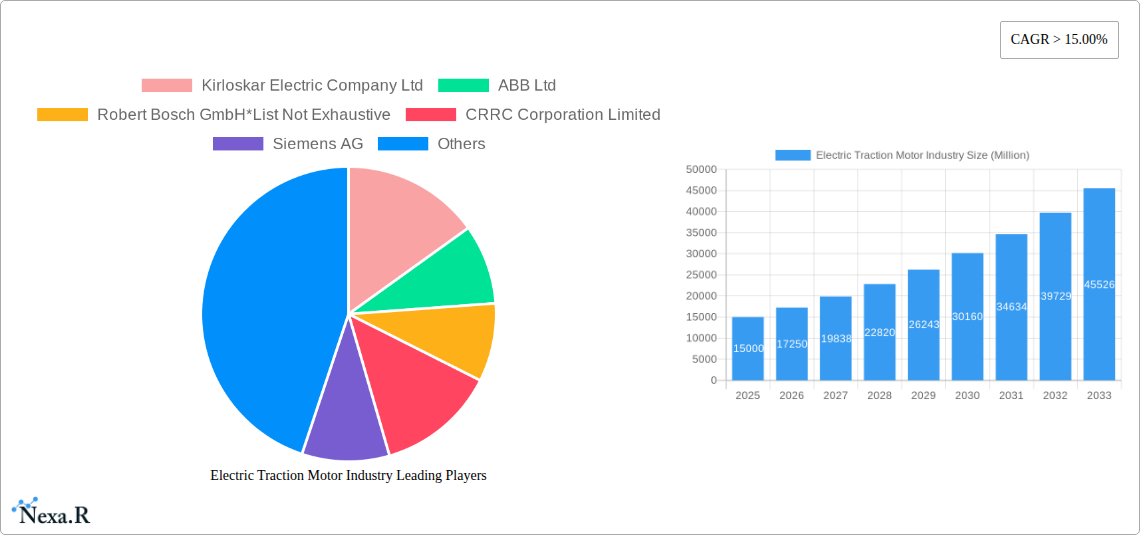
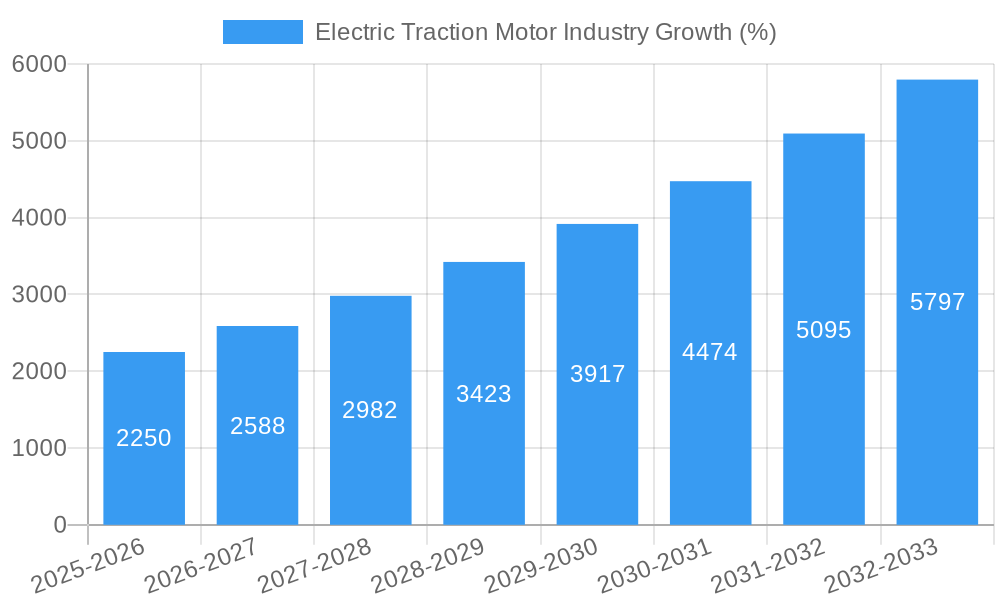
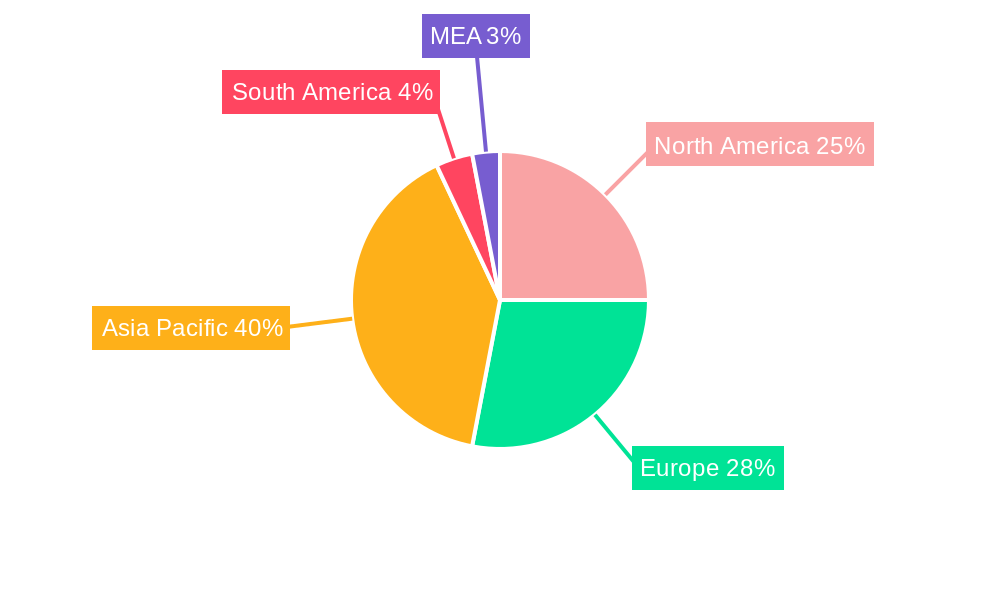
The global electric traction motor market is experiencing robust growth, driven by the burgeoning electric vehicle (EV) sector, the increasing adoption of electric railway systems, and the rising demand for energy-efficient industrial machinery. A Compound Annual Growth Rate (CAGR) exceeding 15% indicates a significant expansion projected from 2025 to 2033. This surge is fueled by stringent government regulations promoting sustainable transportation and the continuous advancements in motor technology leading to higher efficiency, power density, and reliability. The market segmentation reveals a diverse landscape, with alternating current (AC) motors holding a larger market share compared to direct current (DC) motors due to their superior performance characteristics in high-power applications. Within the power rating segment, the 200-400 kW category is expected to witness significant growth, mirroring the demand from medium-sized EVs and railway locomotives. Geographically, Asia-Pacific, led by China and India, is anticipated to dominate the market, owing to substantial investments in infrastructure development and the rapid expansion of their EV and railway networks. North America and Europe will also contribute significantly, driven by robust government policies supporting electric mobility and industrial automation. Key players like ABB, Siemens, and others are strategically investing in research and development to enhance motor technology and cater to the growing market demands.
The competitive landscape is marked by the presence of established players and emerging companies vying for market share. Competition is expected to intensify, leading to increased innovation in motor design, material selection, and manufacturing processes. While the high initial investment costs for electric traction motors can act as a restraint, the long-term cost savings achieved through reduced energy consumption and lower maintenance requirements are offsetting this factor. Moreover, ongoing technological advancements, such as the development of high-efficiency permanent magnet motors and silicon carbide inverters, are further propelling market growth. The market is expected to reach a substantial size by 2033, surpassing current projections based on the sustained high CAGR. The continued focus on sustainability and the global shift towards electric transportation will remain key drivers, ensuring this market’s consistent and significant expansion in the coming years.
Electric Traction Motor Industry: A Comprehensive Market Report (2019-2033)
This comprehensive report provides an in-depth analysis of the Electric Traction Motor industry, encompassing market dynamics, growth trends, regional dominance, product landscape, key players, and future outlook. The study period covers 2019-2033, with a base year of 2025 and a forecast period of 2025-2033. The report segments the market by type (Alternating Current, Direct Current), power rating (Below 200 kW, 200-400 kW, Above 400 kW), and application (Railway, Electric Vehicle, Industrial Machinery, Others), providing granular insights for informed decision-making. Key players like Kirloskar Electric Company Ltd, ABB Ltd, Robert Bosch GmbH, CRRC Corporation Limited, Siemens AG, Alstom SA, Traktionssysteme Austria (TSA) GmbH, CG Power and Industrial Solutions Ltd, General Electric Company, and Skoda Transportation AS are analyzed, although this list is not exhaustive. The report is designed for industry professionals, investors, and strategic planners seeking a clear understanding of this rapidly evolving market.
Electric Traction Motor Industry Market Dynamics & Structure
This section analyzes the competitive landscape, technological advancements, and regulatory influences shaping the electric traction motor market. The market is characterized by a moderate level of concentration, with a few major players holding significant market share, while numerous smaller companies cater to niche segments. Technological innovation, particularly in power electronics and motor design, is a key driver, fostering improved efficiency, higher power density, and reduced costs.
- Market Concentration: xx% of the market is controlled by the top 5 players in 2025.
- Technological Innovation: Focus on silicon carbide (SiC) and gallium nitride (GaN) based inverters, permanent magnet synchronous motors (PMSM), and advanced control algorithms.
- Regulatory Frameworks: Stringent emission regulations and government incentives for electric transportation are significantly boosting market growth.
- Competitive Substitutes: Internal combustion engines (ICE) remain a significant competitor, although their market share is declining steadily.
- End-User Demographics: The railway sector currently dominates the market, followed by the rapidly growing electric vehicle segment.
- M&A Trends: The number of M&A deals in the sector averaged xx per year during the historical period (2019-2024), indicating a consolidated market.
Electric Traction Motor Industry Growth Trends & Insights
The global electric traction motor market experienced robust growth during the historical period (2019-2024), driven primarily by the increasing adoption of electric vehicles and the expansion of railway networks globally. The market size is estimated at xx million units in 2025, with a projected CAGR of xx% during the forecast period (2025-2033). This growth is fueled by several factors, including rising environmental concerns, government support for sustainable transportation, technological advancements leading to improved efficiency and performance, and decreasing battery costs. Consumer preference shifts towards electric and hybrid vehicles are accelerating market penetration, and technological disruptions like the advent of high-power density motors and advanced control systems are further enhancing market dynamics. The adoption rate is expected to increase significantly over the forecast period, reaching xx% penetration by 2033.
Dominant Regions, Countries, or Segments in Electric Traction Motor Industry
The electric traction motor market exhibits significant regional variations, with Asia-Pacific projected to be the leading region throughout the forecast period due to robust growth in the electric vehicle and railway sectors in countries like China and India. Europe and North America also contribute significantly, driven by strong governmental support for electric transportation and a mature railway infrastructure.
- Dominant Segment: The railway segment is currently the largest application area, accounting for xx million units in 2025. However, the electric vehicle segment is poised for rapid growth, driven by rising EV sales.
- Key Drivers: Government policies promoting electric vehicles and sustainable transportation, expansion of railway infrastructure projects, increasing urbanization leading to higher demand for public transportation, and rising disposable incomes boosting consumer demand.
- Dominant Country: China is projected to be the largest market, driven by its massive electric vehicle production and extensive railway network.
Electric Traction Motor Industry Product Landscape
Electric traction motors are undergoing significant advancements, with a focus on improving efficiency, reducing weight, and enhancing reliability. The incorporation of advanced materials, such as high-strength magnets and improved insulation technologies, is key to enhancing performance metrics. Unique selling propositions (USPs) include higher power density, improved thermal management, and advanced control algorithms enabling precise torque and speed control. This leads to higher vehicle efficiency and extended operating life.
Key Drivers, Barriers & Challenges in Electric Traction Motor Industry
Key Drivers: Increased demand for electric vehicles, stringent emission regulations, government investments in public transportation, advancements in battery technology, and the growing adoption of hybrid electric vehicles are key drivers.
Challenges: High initial investment costs, the complexity of integrating electric traction motors into vehicles, competition from established ICE manufacturers, supply chain disruptions impacting the availability of raw materials, and the need for skilled labor to design and manufacture these motors pose significant challenges.
Emerging Opportunities in Electric Traction Motor Industry
The electric traction motor market presents several emerging opportunities, including expansion into developing economies, the integration of electric traction motors into diverse applications such as aerial work platforms, and the development of innovative motor designs optimized for specific vehicle types. The increasing demand for autonomous vehicles and the growth of the last-mile delivery market are also creating new opportunities.
Growth Accelerators in the Electric Traction Motor Industry
Technological breakthroughs in power electronics, motor design, and control algorithms, coupled with strategic partnerships between motor manufacturers and vehicle OEMs, are accelerating market growth. Government policies promoting electric transportation and increasing investments in infrastructure are further enhancing market expansion.
Key Players Shaping the Electric Traction Motor Industry Market
- Kirloskar Electric Company Ltd
- ABB Ltd
- Robert Bosch GmbH
- CRRC Corporation Limited
- Siemens AG
- Alstom SA
- Traktionssysteme Austria (TSA) GmbH
- CG Power and Industrial Solutions Ltd
- General Electric Company
- Skoda Transportation AS
Notable Milestones in Electric Traction Motor Industry Sector
- 2020: Introduction of a new generation of high-efficiency electric traction motors by ABB.
- 2021: Siemens AG and Alstom SA announce a strategic partnership to develop next-generation traction systems.
- 2022: Significant investments by several companies in the research and development of SiC-based inverters for traction applications.
- 2023: Launch of several new electric vehicle models equipped with advanced electric traction motors.
In-Depth Electric Traction Motor Industry Market Outlook
The electric traction motor market is poised for continued strong growth over the forecast period, driven by sustained demand for electric vehicles and the ongoing expansion of railway infrastructure globally. Strategic partnerships, technological innovation, and favorable government policies will be instrumental in shaping the market's future trajectory. The market is expected to reach xx million units by 2033, presenting significant opportunities for companies that can deliver high-performance, cost-effective solutions.
Electric Traction Motor Industry Segmentation
-
1. Type
- 1.1. Alternating Current
- 1.2. Direct Current
-
2. Power Rating
- 2.1. Below 200 kW
- 2.2. 200 - 400 kW
- 2.3. Above 400 kW
-
3. Application
- 3.1. Railway
- 3.2. Electric Vehicle
- 3.3. Industrial Machinery
- 3.4. Others
Electric Traction Motor Industry Segmentation By Geography
- 1. North America
- 2. Asia Pacific
- 3. Europe
- 4. South America
- 5. Middle East and Africa
Electric Traction Motor Industry REPORT HIGHLIGHTS
| Aspects | Details |
|---|---|
| Study Period | 2019-2033 |
| Base Year | 2024 |
| Estimated Year | 2025 |
| Forecast Period | 2025-2033 |
| Historical Period | 2019-2024 |
| Growth Rate | CAGR of > 15.00% from 2019-2033 |
| Segmentation |
|
Table of Contents
- 1. Introduction
- 1.1. Research Scope
- 1.2. Market Segmentation
- 1.3. Research Methodology
- 1.4. Definitions and Assumptions
- 2. Executive Summary
- 2.1. Introduction
- 3. Market Dynamics
- 3.1. Introduction
- 3.2. Market Drivers
- 3.2.1. 4.; Increasing Integration Of Renewable Energy Generation4.; Aging Power Grids And Investments In Transmission And Distribution Infrastructure
- 3.3. Market Restrains
- 3.3.1. 4.; Lack Of Investor Confidence Due To Sociopolitical Instability In Some Countries
- 3.4. Market Trends
- 3.4.1. Electric Vehicle to Witness Significant Growth
- 4. Market Factor Analysis
- 4.1. Porters Five Forces
- 4.2. Supply/Value Chain
- 4.3. PESTEL analysis
- 4.4. Market Entropy
- 4.5. Patent/Trademark Analysis
- 5. Global Electric Traction Motor Industry Analysis, Insights and Forecast, 2019-2031
- 5.1. Market Analysis, Insights and Forecast - by Type
- 5.1.1. Alternating Current
- 5.1.2. Direct Current
- 5.2. Market Analysis, Insights and Forecast - by Power Rating
- 5.2.1. Below 200 kW
- 5.2.2. 200 - 400 kW
- 5.2.3. Above 400 kW
- 5.3. Market Analysis, Insights and Forecast - by Application
- 5.3.1. Railway
- 5.3.2. Electric Vehicle
- 5.3.3. Industrial Machinery
- 5.3.4. Others
- 5.4. Market Analysis, Insights and Forecast - by Region
- 5.4.1. North America
- 5.4.2. Asia Pacific
- 5.4.3. Europe
- 5.4.4. South America
- 5.4.5. Middle East and Africa
- 5.1. Market Analysis, Insights and Forecast - by Type
- 6. North America Electric Traction Motor Industry Analysis, Insights and Forecast, 2019-2031
- 6.1. Market Analysis, Insights and Forecast - by Type
- 6.1.1. Alternating Current
- 6.1.2. Direct Current
- 6.2. Market Analysis, Insights and Forecast - by Power Rating
- 6.2.1. Below 200 kW
- 6.2.2. 200 - 400 kW
- 6.2.3. Above 400 kW
- 6.3. Market Analysis, Insights and Forecast - by Application
- 6.3.1. Railway
- 6.3.2. Electric Vehicle
- 6.3.3. Industrial Machinery
- 6.3.4. Others
- 6.1. Market Analysis, Insights and Forecast - by Type
- 7. Asia Pacific Electric Traction Motor Industry Analysis, Insights and Forecast, 2019-2031
- 7.1. Market Analysis, Insights and Forecast - by Type
- 7.1.1. Alternating Current
- 7.1.2. Direct Current
- 7.2. Market Analysis, Insights and Forecast - by Power Rating
- 7.2.1. Below 200 kW
- 7.2.2. 200 - 400 kW
- 7.2.3. Above 400 kW
- 7.3. Market Analysis, Insights and Forecast - by Application
- 7.3.1. Railway
- 7.3.2. Electric Vehicle
- 7.3.3. Industrial Machinery
- 7.3.4. Others
- 7.1. Market Analysis, Insights and Forecast - by Type
- 8. Europe Electric Traction Motor Industry Analysis, Insights and Forecast, 2019-2031
- 8.1. Market Analysis, Insights and Forecast - by Type
- 8.1.1. Alternating Current
- 8.1.2. Direct Current
- 8.2. Market Analysis, Insights and Forecast - by Power Rating
- 8.2.1. Below 200 kW
- 8.2.2. 200 - 400 kW
- 8.2.3. Above 400 kW
- 8.3. Market Analysis, Insights and Forecast - by Application
- 8.3.1. Railway
- 8.3.2. Electric Vehicle
- 8.3.3. Industrial Machinery
- 8.3.4. Others
- 8.1. Market Analysis, Insights and Forecast - by Type
- 9. South America Electric Traction Motor Industry Analysis, Insights and Forecast, 2019-2031
- 9.1. Market Analysis, Insights and Forecast - by Type
- 9.1.1. Alternating Current
- 9.1.2. Direct Current
- 9.2. Market Analysis, Insights and Forecast - by Power Rating
- 9.2.1. Below 200 kW
- 9.2.2. 200 - 400 kW
- 9.2.3. Above 400 kW
- 9.3. Market Analysis, Insights and Forecast - by Application
- 9.3.1. Railway
- 9.3.2. Electric Vehicle
- 9.3.3. Industrial Machinery
- 9.3.4. Others
- 9.1. Market Analysis, Insights and Forecast - by Type
- 10. Middle East and Africa Electric Traction Motor Industry Analysis, Insights and Forecast, 2019-2031
- 10.1. Market Analysis, Insights and Forecast - by Type
- 10.1.1. Alternating Current
- 10.1.2. Direct Current
- 10.2. Market Analysis, Insights and Forecast - by Power Rating
- 10.2.1. Below 200 kW
- 10.2.2. 200 - 400 kW
- 10.2.3. Above 400 kW
- 10.3. Market Analysis, Insights and Forecast - by Application
- 10.3.1. Railway
- 10.3.2. Electric Vehicle
- 10.3.3. Industrial Machinery
- 10.3.4. Others
- 10.1. Market Analysis, Insights and Forecast - by Type
- 11. North America Electric Traction Motor Industry Analysis, Insights and Forecast, 2019-2031
- 11.1. Market Analysis, Insights and Forecast - By Country/Sub-region
- 11.1.1 United States
- 11.1.2 Canada
- 11.1.3 Mexico
- 12. Europe Electric Traction Motor Industry Analysis, Insights and Forecast, 2019-2031
- 12.1. Market Analysis, Insights and Forecast - By Country/Sub-region
- 12.1.1 Germany
- 12.1.2 United Kingdom
- 12.1.3 France
- 12.1.4 Spain
- 12.1.5 Italy
- 12.1.6 Spain
- 12.1.7 Belgium
- 12.1.8 Netherland
- 12.1.9 Nordics
- 12.1.10 Rest of Europe
- 13. Asia Pacific Electric Traction Motor Industry Analysis, Insights and Forecast, 2019-2031
- 13.1. Market Analysis, Insights and Forecast - By Country/Sub-region
- 13.1.1 China
- 13.1.2 Japan
- 13.1.3 India
- 13.1.4 South Korea
- 13.1.5 Southeast Asia
- 13.1.6 Australia
- 13.1.7 Indonesia
- 13.1.8 Phillipes
- 13.1.9 Singapore
- 13.1.10 Thailandc
- 13.1.11 Rest of Asia Pacific
- 14. South America Electric Traction Motor Industry Analysis, Insights and Forecast, 2019-2031
- 14.1. Market Analysis, Insights and Forecast - By Country/Sub-region
- 14.1.1 Brazil
- 14.1.2 Argentina
- 14.1.3 Peru
- 14.1.4 Chile
- 14.1.5 Colombia
- 14.1.6 Ecuador
- 14.1.7 Venezuela
- 14.1.8 Rest of South America
- 15. North America Electric Traction Motor Industry Analysis, Insights and Forecast, 2019-2031
- 15.1. Market Analysis, Insights and Forecast - By Country/Sub-region
- 15.1.1 United States
- 15.1.2 Canada
- 15.1.3 Mexico
- 16. MEA Electric Traction Motor Industry Analysis, Insights and Forecast, 2019-2031
- 16.1. Market Analysis, Insights and Forecast - By Country/Sub-region
- 16.1.1 United Arab Emirates
- 16.1.2 Saudi Arabia
- 16.1.3 South Africa
- 16.1.4 Rest of Middle East and Africa
- 17. Competitive Analysis
- 17.1. Global Market Share Analysis 2024
- 17.2. Company Profiles
- 17.2.1 Kirloskar Electric Company Ltd
- 17.2.1.1. Overview
- 17.2.1.2. Products
- 17.2.1.3. SWOT Analysis
- 17.2.1.4. Recent Developments
- 17.2.1.5. Financials (Based on Availability)
- 17.2.2 ABB Ltd
- 17.2.2.1. Overview
- 17.2.2.2. Products
- 17.2.2.3. SWOT Analysis
- 17.2.2.4. Recent Developments
- 17.2.2.5. Financials (Based on Availability)
- 17.2.3 Robert Bosch GmbH*List Not Exhaustive
- 17.2.3.1. Overview
- 17.2.3.2. Products
- 17.2.3.3. SWOT Analysis
- 17.2.3.4. Recent Developments
- 17.2.3.5. Financials (Based on Availability)
- 17.2.4 CRRC Corporation Limited
- 17.2.4.1. Overview
- 17.2.4.2. Products
- 17.2.4.3. SWOT Analysis
- 17.2.4.4. Recent Developments
- 17.2.4.5. Financials (Based on Availability)
- 17.2.5 Siemens AG
- 17.2.5.1. Overview
- 17.2.5.2. Products
- 17.2.5.3. SWOT Analysis
- 17.2.5.4. Recent Developments
- 17.2.5.5. Financials (Based on Availability)
- 17.2.6 Alstom SA
- 17.2.6.1. Overview
- 17.2.6.2. Products
- 17.2.6.3. SWOT Analysis
- 17.2.6.4. Recent Developments
- 17.2.6.5. Financials (Based on Availability)
- 17.2.7 Traktionssysteme Austria (TSA) GmbH
- 17.2.7.1. Overview
- 17.2.7.2. Products
- 17.2.7.3. SWOT Analysis
- 17.2.7.4. Recent Developments
- 17.2.7.5. Financials (Based on Availability)
- 17.2.8 CG Power and Industrial Solutions Ltd
- 17.2.8.1. Overview
- 17.2.8.2. Products
- 17.2.8.3. SWOT Analysis
- 17.2.8.4. Recent Developments
- 17.2.8.5. Financials (Based on Availability)
- 17.2.9 General Electric Company
- 17.2.9.1. Overview
- 17.2.9.2. Products
- 17.2.9.3. SWOT Analysis
- 17.2.9.4. Recent Developments
- 17.2.9.5. Financials (Based on Availability)
- 17.2.10 Skoda Transportation AS
- 17.2.10.1. Overview
- 17.2.10.2. Products
- 17.2.10.3. SWOT Analysis
- 17.2.10.4. Recent Developments
- 17.2.10.5. Financials (Based on Availability)
- 17.2.1 Kirloskar Electric Company Ltd
List of Figures
- Figure 1: Global Electric Traction Motor Industry Revenue Breakdown (Million, %) by Region 2024 & 2032
- Figure 2: North America Electric Traction Motor Industry Revenue (Million), by Country 2024 & 2032
- Figure 3: North America Electric Traction Motor Industry Revenue Share (%), by Country 2024 & 2032
- Figure 4: Europe Electric Traction Motor Industry Revenue (Million), by Country 2024 & 2032
- Figure 5: Europe Electric Traction Motor Industry Revenue Share (%), by Country 2024 & 2032
- Figure 6: Asia Pacific Electric Traction Motor Industry Revenue (Million), by Country 2024 & 2032
- Figure 7: Asia Pacific Electric Traction Motor Industry Revenue Share (%), by Country 2024 & 2032
- Figure 8: South America Electric Traction Motor Industry Revenue (Million), by Country 2024 & 2032
- Figure 9: South America Electric Traction Motor Industry Revenue Share (%), by Country 2024 & 2032
- Figure 10: North America Electric Traction Motor Industry Revenue (Million), by Country 2024 & 2032
- Figure 11: North America Electric Traction Motor Industry Revenue Share (%), by Country 2024 & 2032
- Figure 12: MEA Electric Traction Motor Industry Revenue (Million), by Country 2024 & 2032
- Figure 13: MEA Electric Traction Motor Industry Revenue Share (%), by Country 2024 & 2032
- Figure 14: North America Electric Traction Motor Industry Revenue (Million), by Type 2024 & 2032
- Figure 15: North America Electric Traction Motor Industry Revenue Share (%), by Type 2024 & 2032
- Figure 16: North America Electric Traction Motor Industry Revenue (Million), by Power Rating 2024 & 2032
- Figure 17: North America Electric Traction Motor Industry Revenue Share (%), by Power Rating 2024 & 2032
- Figure 18: North America Electric Traction Motor Industry Revenue (Million), by Application 2024 & 2032
- Figure 19: North America Electric Traction Motor Industry Revenue Share (%), by Application 2024 & 2032
- Figure 20: North America Electric Traction Motor Industry Revenue (Million), by Country 2024 & 2032
- Figure 21: North America Electric Traction Motor Industry Revenue Share (%), by Country 2024 & 2032
- Figure 22: Asia Pacific Electric Traction Motor Industry Revenue (Million), by Type 2024 & 2032
- Figure 23: Asia Pacific Electric Traction Motor Industry Revenue Share (%), by Type 2024 & 2032
- Figure 24: Asia Pacific Electric Traction Motor Industry Revenue (Million), by Power Rating 2024 & 2032
- Figure 25: Asia Pacific Electric Traction Motor Industry Revenue Share (%), by Power Rating 2024 & 2032
- Figure 26: Asia Pacific Electric Traction Motor Industry Revenue (Million), by Application 2024 & 2032
- Figure 27: Asia Pacific Electric Traction Motor Industry Revenue Share (%), by Application 2024 & 2032
- Figure 28: Asia Pacific Electric Traction Motor Industry Revenue (Million), by Country 2024 & 2032
- Figure 29: Asia Pacific Electric Traction Motor Industry Revenue Share (%), by Country 2024 & 2032
- Figure 30: Europe Electric Traction Motor Industry Revenue (Million), by Type 2024 & 2032
- Figure 31: Europe Electric Traction Motor Industry Revenue Share (%), by Type 2024 & 2032
- Figure 32: Europe Electric Traction Motor Industry Revenue (Million), by Power Rating 2024 & 2032
- Figure 33: Europe Electric Traction Motor Industry Revenue Share (%), by Power Rating 2024 & 2032
- Figure 34: Europe Electric Traction Motor Industry Revenue (Million), by Application 2024 & 2032
- Figure 35: Europe Electric Traction Motor Industry Revenue Share (%), by Application 2024 & 2032
- Figure 36: Europe Electric Traction Motor Industry Revenue (Million), by Country 2024 & 2032
- Figure 37: Europe Electric Traction Motor Industry Revenue Share (%), by Country 2024 & 2032
- Figure 38: South America Electric Traction Motor Industry Revenue (Million), by Type 2024 & 2032
- Figure 39: South America Electric Traction Motor Industry Revenue Share (%), by Type 2024 & 2032
- Figure 40: South America Electric Traction Motor Industry Revenue (Million), by Power Rating 2024 & 2032
- Figure 41: South America Electric Traction Motor Industry Revenue Share (%), by Power Rating 2024 & 2032
- Figure 42: South America Electric Traction Motor Industry Revenue (Million), by Application 2024 & 2032
- Figure 43: South America Electric Traction Motor Industry Revenue Share (%), by Application 2024 & 2032
- Figure 44: South America Electric Traction Motor Industry Revenue (Million), by Country 2024 & 2032
- Figure 45: South America Electric Traction Motor Industry Revenue Share (%), by Country 2024 & 2032
- Figure 46: Middle East and Africa Electric Traction Motor Industry Revenue (Million), by Type 2024 & 2032
- Figure 47: Middle East and Africa Electric Traction Motor Industry Revenue Share (%), by Type 2024 & 2032
- Figure 48: Middle East and Africa Electric Traction Motor Industry Revenue (Million), by Power Rating 2024 & 2032
- Figure 49: Middle East and Africa Electric Traction Motor Industry Revenue Share (%), by Power Rating 2024 & 2032
- Figure 50: Middle East and Africa Electric Traction Motor Industry Revenue (Million), by Application 2024 & 2032
- Figure 51: Middle East and Africa Electric Traction Motor Industry Revenue Share (%), by Application 2024 & 2032
- Figure 52: Middle East and Africa Electric Traction Motor Industry Revenue (Million), by Country 2024 & 2032
- Figure 53: Middle East and Africa Electric Traction Motor Industry Revenue Share (%), by Country 2024 & 2032
List of Tables
- Table 1: Global Electric Traction Motor Industry Revenue Million Forecast, by Region 2019 & 2032
- Table 2: Global Electric Traction Motor Industry Revenue Million Forecast, by Type 2019 & 2032
- Table 3: Global Electric Traction Motor Industry Revenue Million Forecast, by Power Rating 2019 & 2032
- Table 4: Global Electric Traction Motor Industry Revenue Million Forecast, by Application 2019 & 2032
- Table 5: Global Electric Traction Motor Industry Revenue Million Forecast, by Region 2019 & 2032
- Table 6: Global Electric Traction Motor Industry Revenue Million Forecast, by Country 2019 & 2032
- Table 7: United States Electric Traction Motor Industry Revenue (Million) Forecast, by Application 2019 & 2032
- Table 8: Canada Electric Traction Motor Industry Revenue (Million) Forecast, by Application 2019 & 2032
- Table 9: Mexico Electric Traction Motor Industry Revenue (Million) Forecast, by Application 2019 & 2032
- Table 10: Global Electric Traction Motor Industry Revenue Million Forecast, by Country 2019 & 2032
- Table 11: Germany Electric Traction Motor Industry Revenue (Million) Forecast, by Application 2019 & 2032
- Table 12: United Kingdom Electric Traction Motor Industry Revenue (Million) Forecast, by Application 2019 & 2032
- Table 13: France Electric Traction Motor Industry Revenue (Million) Forecast, by Application 2019 & 2032
- Table 14: Spain Electric Traction Motor Industry Revenue (Million) Forecast, by Application 2019 & 2032
- Table 15: Italy Electric Traction Motor Industry Revenue (Million) Forecast, by Application 2019 & 2032
- Table 16: Spain Electric Traction Motor Industry Revenue (Million) Forecast, by Application 2019 & 2032
- Table 17: Belgium Electric Traction Motor Industry Revenue (Million) Forecast, by Application 2019 & 2032
- Table 18: Netherland Electric Traction Motor Industry Revenue (Million) Forecast, by Application 2019 & 2032
- Table 19: Nordics Electric Traction Motor Industry Revenue (Million) Forecast, by Application 2019 & 2032
- Table 20: Rest of Europe Electric Traction Motor Industry Revenue (Million) Forecast, by Application 2019 & 2032
- Table 21: Global Electric Traction Motor Industry Revenue Million Forecast, by Country 2019 & 2032
- Table 22: China Electric Traction Motor Industry Revenue (Million) Forecast, by Application 2019 & 2032
- Table 23: Japan Electric Traction Motor Industry Revenue (Million) Forecast, by Application 2019 & 2032
- Table 24: India Electric Traction Motor Industry Revenue (Million) Forecast, by Application 2019 & 2032
- Table 25: South Korea Electric Traction Motor Industry Revenue (Million) Forecast, by Application 2019 & 2032
- Table 26: Southeast Asia Electric Traction Motor Industry Revenue (Million) Forecast, by Application 2019 & 2032
- Table 27: Australia Electric Traction Motor Industry Revenue (Million) Forecast, by Application 2019 & 2032
- Table 28: Indonesia Electric Traction Motor Industry Revenue (Million) Forecast, by Application 2019 & 2032
- Table 29: Phillipes Electric Traction Motor Industry Revenue (Million) Forecast, by Application 2019 & 2032
- Table 30: Singapore Electric Traction Motor Industry Revenue (Million) Forecast, by Application 2019 & 2032
- Table 31: Thailandc Electric Traction Motor Industry Revenue (Million) Forecast, by Application 2019 & 2032
- Table 32: Rest of Asia Pacific Electric Traction Motor Industry Revenue (Million) Forecast, by Application 2019 & 2032
- Table 33: Global Electric Traction Motor Industry Revenue Million Forecast, by Country 2019 & 2032
- Table 34: Brazil Electric Traction Motor Industry Revenue (Million) Forecast, by Application 2019 & 2032
- Table 35: Argentina Electric Traction Motor Industry Revenue (Million) Forecast, by Application 2019 & 2032
- Table 36: Peru Electric Traction Motor Industry Revenue (Million) Forecast, by Application 2019 & 2032
- Table 37: Chile Electric Traction Motor Industry Revenue (Million) Forecast, by Application 2019 & 2032
- Table 38: Colombia Electric Traction Motor Industry Revenue (Million) Forecast, by Application 2019 & 2032
- Table 39: Ecuador Electric Traction Motor Industry Revenue (Million) Forecast, by Application 2019 & 2032
- Table 40: Venezuela Electric Traction Motor Industry Revenue (Million) Forecast, by Application 2019 & 2032
- Table 41: Rest of South America Electric Traction Motor Industry Revenue (Million) Forecast, by Application 2019 & 2032
- Table 42: Global Electric Traction Motor Industry Revenue Million Forecast, by Country 2019 & 2032
- Table 43: United States Electric Traction Motor Industry Revenue (Million) Forecast, by Application 2019 & 2032
- Table 44: Canada Electric Traction Motor Industry Revenue (Million) Forecast, by Application 2019 & 2032
- Table 45: Mexico Electric Traction Motor Industry Revenue (Million) Forecast, by Application 2019 & 2032
- Table 46: Global Electric Traction Motor Industry Revenue Million Forecast, by Country 2019 & 2032
- Table 47: United Arab Emirates Electric Traction Motor Industry Revenue (Million) Forecast, by Application 2019 & 2032
- Table 48: Saudi Arabia Electric Traction Motor Industry Revenue (Million) Forecast, by Application 2019 & 2032
- Table 49: South Africa Electric Traction Motor Industry Revenue (Million) Forecast, by Application 2019 & 2032
- Table 50: Rest of Middle East and Africa Electric Traction Motor Industry Revenue (Million) Forecast, by Application 2019 & 2032
- Table 51: Global Electric Traction Motor Industry Revenue Million Forecast, by Type 2019 & 2032
- Table 52: Global Electric Traction Motor Industry Revenue Million Forecast, by Power Rating 2019 & 2032
- Table 53: Global Electric Traction Motor Industry Revenue Million Forecast, by Application 2019 & 2032
- Table 54: Global Electric Traction Motor Industry Revenue Million Forecast, by Country 2019 & 2032
- Table 55: Global Electric Traction Motor Industry Revenue Million Forecast, by Type 2019 & 2032
- Table 56: Global Electric Traction Motor Industry Revenue Million Forecast, by Power Rating 2019 & 2032
- Table 57: Global Electric Traction Motor Industry Revenue Million Forecast, by Application 2019 & 2032
- Table 58: Global Electric Traction Motor Industry Revenue Million Forecast, by Country 2019 & 2032
- Table 59: Global Electric Traction Motor Industry Revenue Million Forecast, by Type 2019 & 2032
- Table 60: Global Electric Traction Motor Industry Revenue Million Forecast, by Power Rating 2019 & 2032
- Table 61: Global Electric Traction Motor Industry Revenue Million Forecast, by Application 2019 & 2032
- Table 62: Global Electric Traction Motor Industry Revenue Million Forecast, by Country 2019 & 2032
- Table 63: Global Electric Traction Motor Industry Revenue Million Forecast, by Type 2019 & 2032
- Table 64: Global Electric Traction Motor Industry Revenue Million Forecast, by Power Rating 2019 & 2032
- Table 65: Global Electric Traction Motor Industry Revenue Million Forecast, by Application 2019 & 2032
- Table 66: Global Electric Traction Motor Industry Revenue Million Forecast, by Country 2019 & 2032
- Table 67: Global Electric Traction Motor Industry Revenue Million Forecast, by Type 2019 & 2032
- Table 68: Global Electric Traction Motor Industry Revenue Million Forecast, by Power Rating 2019 & 2032
- Table 69: Global Electric Traction Motor Industry Revenue Million Forecast, by Application 2019 & 2032
- Table 70: Global Electric Traction Motor Industry Revenue Million Forecast, by Country 2019 & 2032
Frequently Asked Questions
1. What is the projected Compound Annual Growth Rate (CAGR) of the Electric Traction Motor Industry?
The projected CAGR is approximately > 15.00%.
2. Which companies are prominent players in the Electric Traction Motor Industry?
Key companies in the market include Kirloskar Electric Company Ltd, ABB Ltd, Robert Bosch GmbH*List Not Exhaustive, CRRC Corporation Limited, Siemens AG, Alstom SA, Traktionssysteme Austria (TSA) GmbH, CG Power and Industrial Solutions Ltd, General Electric Company, Skoda Transportation AS.
3. What are the main segments of the Electric Traction Motor Industry?
The market segments include Type, Power Rating, Application.
4. Can you provide details about the market size?
The market size is estimated to be USD XX Million as of 2022.
5. What are some drivers contributing to market growth?
4.; Increasing Integration Of Renewable Energy Generation4.; Aging Power Grids And Investments In Transmission And Distribution Infrastructure.
6. What are the notable trends driving market growth?
Electric Vehicle to Witness Significant Growth.
7. Are there any restraints impacting market growth?
4.; Lack Of Investor Confidence Due To Sociopolitical Instability In Some Countries.
8. Can you provide examples of recent developments in the market?
N/A
9. What pricing options are available for accessing the report?
Pricing options include single-user, multi-user, and enterprise licenses priced at USD 4750, USD 5250, and USD 8750 respectively.
10. Is the market size provided in terms of value or volume?
The market size is provided in terms of value, measured in Million.
11. Are there any specific market keywords associated with the report?
Yes, the market keyword associated with the report is "Electric Traction Motor Industry," which aids in identifying and referencing the specific market segment covered.
12. How do I determine which pricing option suits my needs best?
The pricing options vary based on user requirements and access needs. Individual users may opt for single-user licenses, while businesses requiring broader access may choose multi-user or enterprise licenses for cost-effective access to the report.
13. Are there any additional resources or data provided in the Electric Traction Motor Industry report?
While the report offers comprehensive insights, it's advisable to review the specific contents or supplementary materials provided to ascertain if additional resources or data are available.
14. How can I stay updated on further developments or reports in the Electric Traction Motor Industry?
To stay informed about further developments, trends, and reports in the Electric Traction Motor Industry, consider subscribing to industry newsletters, following relevant companies and organizations, or regularly checking reputable industry news sources and publications.
Methodology
Step 1 - Identification of Relevant Samples Size from Population Database


Step 2 - Approaches for Defining Global Market Size (Value, Volume* & Price*)

Note*: In applicable scenarios
Step 3 - Data Sources
Primary Research
- Web Analytics
- Survey Reports
- Research Institute
- Latest Research Reports
- Opinion Leaders
Secondary Research
- Annual Reports
- White Paper
- Latest Press Release
- Industry Association
- Paid Database
- Investor Presentations

Step 4 - Data Triangulation
Involves using different sources of information in order to increase the validity of a study
These sources are likely to be stakeholders in a program - participants, other researchers, program staff, other community members, and so on.
Then we put all data in single framework & apply various statistical tools to find out the dynamic on the market.
During the analysis stage, feedback from the stakeholder groups would be compared to determine areas of agreement as well as areas of divergence
