

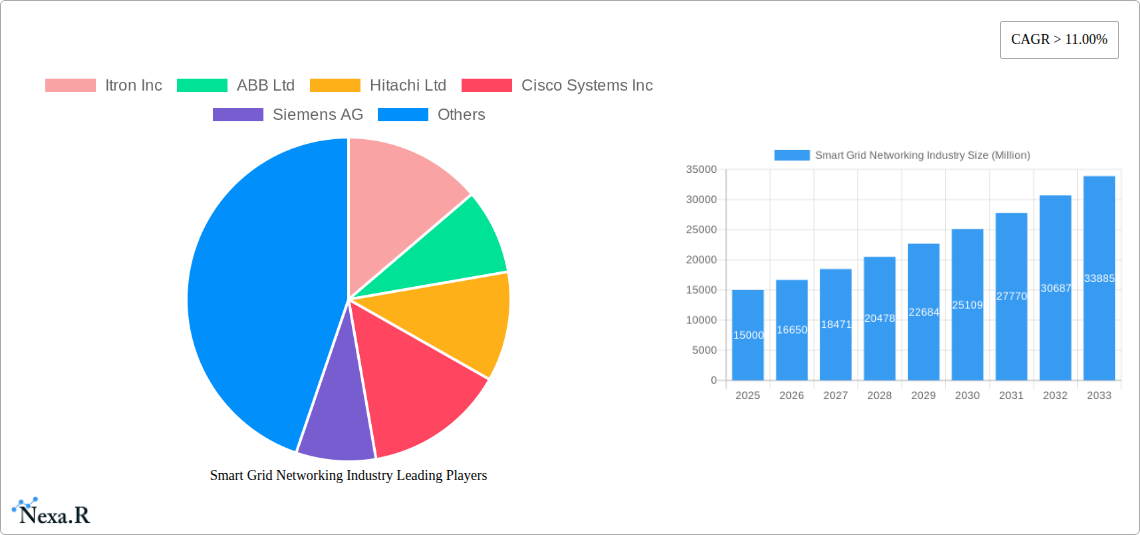
Key Insights
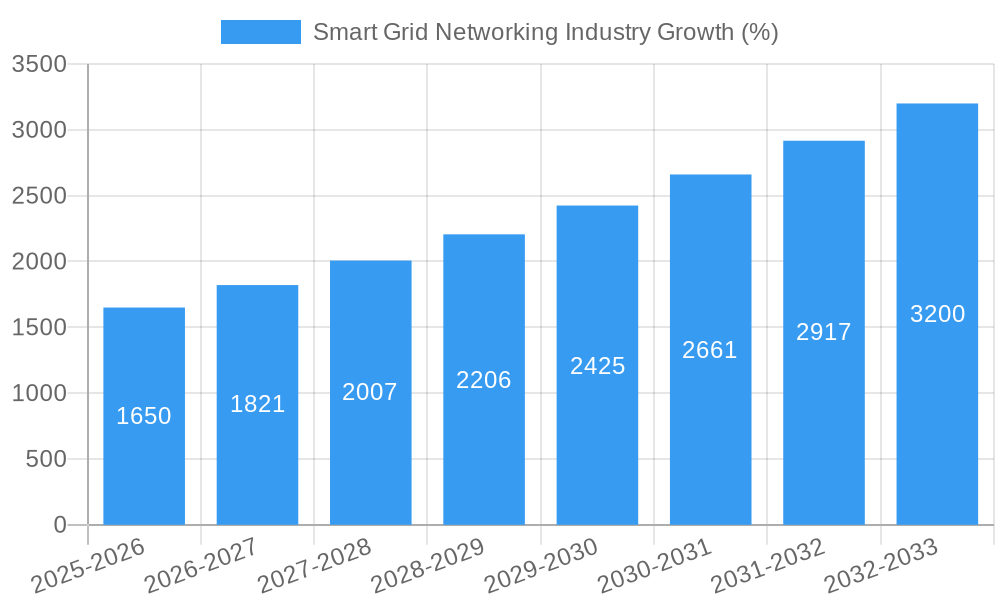
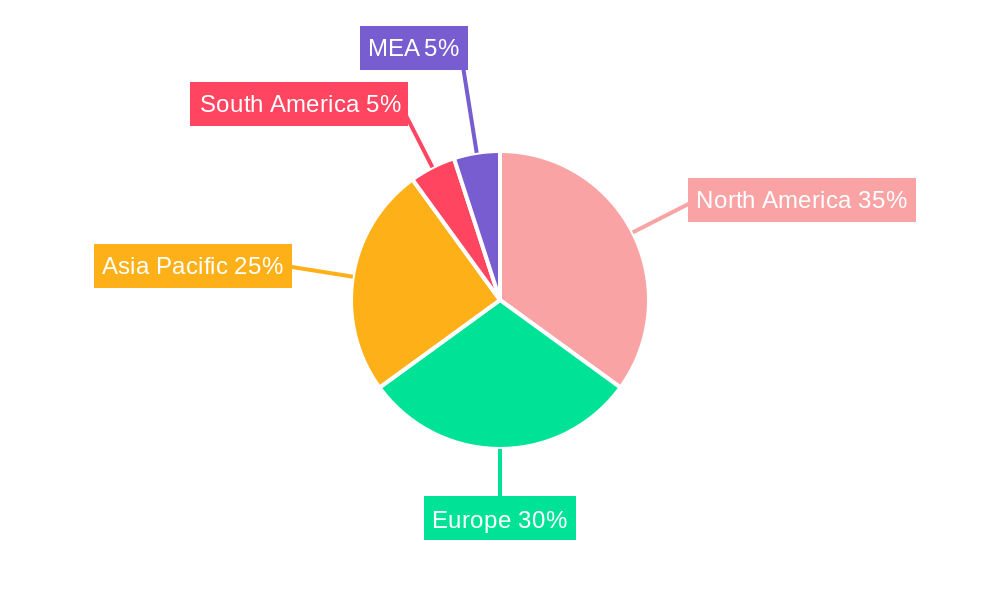
The Smart Grid Networking market is experiencing robust growth, projected to maintain a Compound Annual Growth Rate (CAGR) exceeding 11% from 2025 to 2033. This expansion is fueled by several key drivers. The increasing demand for reliable and efficient electricity distribution, coupled with the growing adoption of renewable energy sources, necessitates sophisticated grid management systems. Smart grid technologies, including Advanced Metering Infrastructure (AMI) for precise energy consumption monitoring, Transmission solutions for optimized power delivery, and Demand Response programs for load balancing, are central to this transformation. Furthermore, government initiatives promoting energy efficiency and smart city development are significantly boosting market adoption. While initial infrastructure investments represent a considerable restraint, the long-term cost savings and improved grid resilience outweigh these upfront expenses. Technological advancements, such as the integration of artificial intelligence and the Internet of Things (IoT) for predictive maintenance and improved grid security, are further accelerating market growth. The market is segmented geographically, with North America and Europe currently leading in adoption due to established infrastructure and supportive regulatory frameworks. However, the Asia-Pacific region is expected to witness significant growth in the coming years driven by rapid urbanization and industrialization. Competition is intense, with established players like Itron, ABB, and Siemens vying for market share alongside emerging technology providers.
The competitive landscape is characterized by both established players and emerging technology companies. Existing market leaders, leveraging their extensive experience and established customer base, are focusing on innovation and strategic partnerships to maintain their competitive edge. New entrants are bringing disruptive technologies and business models, particularly in areas such as software-defined networking and cloud-based grid management solutions. The long-term outlook remains positive, driven by the continuous need for grid modernization, decarbonization efforts, and the increasing integration of distributed energy resources. This necessitates the development of even more sophisticated networking technologies to efficiently manage the complexities of the evolving energy landscape. The focus on cybersecurity and data privacy will continue to be a critical aspect of the market's development, further enhancing the demand for robust and secure smart grid networking solutions.
This comprehensive report provides an in-depth analysis of the Smart Grid Networking market, offering invaluable insights for industry professionals, investors, and strategic decision-makers. With a focus on market dynamics, growth trends, and key players, this report covers the historical period (2019-2024), base year (2025), and forecast period (2025-2033), projecting market values in millions. The parent market is the broader energy sector, and the child market is specifically smart grid technologies.
Smart Grid Networking Industry Market Dynamics & Structure
This section analyzes the competitive landscape, technological advancements, regulatory influences, and market trends within the Smart Grid Networking industry. The market is characterized by a moderately concentrated structure with key players holding significant market share. However, ongoing technological innovation and the entry of new players are reshaping the competitive dynamics.
- Market Concentration: The top 5 players hold approximately xx% of the market share in 2025, indicating a moderately concentrated market.
- Technological Innovation: Advancements in communication technologies (e.g., 5G, IoT), data analytics, and AI are driving the adoption of sophisticated smart grid solutions. However, challenges remain in interoperability and data security.
- Regulatory Frameworks: Government policies promoting renewable energy integration and grid modernization are crucial drivers. Differing regulatory landscapes across regions create both opportunities and challenges.
- Competitive Product Substitutes: While traditional grid infrastructure remains dominant, the emergence of decentralized energy systems and microgrids presents competitive pressures.
- End-User Demographics: Utilities, energy providers, and industrial consumers are the primary end-users, with increasing participation from residential consumers.
- M&A Trends: The market has witnessed significant M&A activity, with xx deals recorded between 2019 and 2024, driven by the need to expand capabilities and market reach. This includes strategic acquisitions targeting advanced technologies and geographic expansion.
Smart Grid Networking Industry Growth Trends & Insights
The Smart Grid Networking market experienced substantial growth during the historical period (2019-2024), driven by increasing demand for reliable and efficient energy distribution. The market size is projected to reach xx million in 2025 and is expected to grow at a CAGR of xx% during the forecast period (2025-2033). This growth is fueled by the global shift towards renewable energy sources and the need for improved grid management to accommodate intermittent renewable energy generation. The adoption of smart meters and grid automation technologies is accelerating market penetration. Consumer behavior is shifting towards greater energy awareness and a willingness to adopt smart energy management solutions.
Dominant Regions, Countries, or Segments in Smart Grid Networking Industry
North America currently holds the largest market share, followed by Europe and Asia-Pacific. The high adoption rates of AMI and demand response programs in North America contribute to its dominance. However, rapid infrastructure development and government initiatives in Asia-Pacific suggest significant growth potential in this region. Within Technology Application Areas, Advanced Metering Infrastructure (AMI) currently holds the largest market share.
- Advanced Metering Infrastructure (AMI): High demand for improved metering accuracy, real-time data monitoring, and reduced energy losses drive this segment's growth.
- Demand Response: Increasing energy prices and incentives from governments are fostering wider adoption of demand response programs.
- Transmission: Upgrading aging transmission infrastructure and integrating renewable energy sources are key drivers.
- Other Technology Application Areas: This segment includes various niche applications with significant growth potential. These include distribution automation and grid edge management.
Key Drivers:
- Strong government support for renewable energy integration.
- Rising energy prices and the need for energy efficiency.
- Increasing demand for reliable and resilient power grids.
- Technological advancements in communication and data analytics.
Smart Grid Networking Industry Product Landscape
The smart grid networking market features a diverse range of products, including smart meters, sensors, communication networks, and software platforms. These products are designed to improve grid monitoring, control, and automation, offering features such as real-time data acquisition, remote control capabilities, and advanced analytics. Innovation focuses on enhanced data security, improved interoperability, and the integration of AI and machine learning for predictive grid management.
Key Drivers, Barriers & Challenges in Smart Grid Networking Industry
Key Drivers:
- Growing demand for renewable energy integration and efficient grid management.
- Increased focus on energy efficiency and reduced carbon emissions.
- Government regulations and incentives promoting smart grid deployments.
Challenges & Restraints:
- High initial investment costs associated with smart grid deployments.
- Concerns about data security and cyberattacks on smart grid infrastructure.
- Interoperability issues between different smart grid technologies and platforms.
- Lack of skilled workforce to design, implement, and maintain smart grid systems.
Emerging Opportunities in Smart Grid Networking Industry
- Expanding into developing economies with rapidly growing energy demand.
- Development of microgrids and distributed energy resource management systems.
- Integration of artificial intelligence and machine learning for predictive grid operations.
- Growing focus on data analytics and cybersecurity to enhance grid resilience and security.
Growth Accelerators in the Smart Grid Networking Industry Industry
Technological advancements, strategic partnerships, and government support are major catalysts for long-term market growth. The integration of renewable energy sources, coupled with intelligent grid management systems, will drive sustained expansion. Furthermore, the emergence of innovative business models and increased private investment will further accelerate market growth.
Key Players Shaping the Smart Grid Networking Market
- Itron Inc
- ABB Ltd
- Hitachi Ltd
- Cisco Systems Inc
- Siemens AG
- Schneider Electric SE
- Eaton Corporation PLC
- General Electric Company
- Honeywell International Inc
- Osaki Electric Co Ltd
Notable Milestones in Smart Grid Networking Industry Sector
- January 2021: Schneider Electric acquired DC Systems BV, enhancing its smart grid capabilities.
- September 2020: Siemens Energy launched its UPFC PLUS, improving grid stability.
In-Depth Smart Grid Networking Industry Market Outlook
The Smart Grid Networking market is poised for significant growth over the forecast period, driven by factors such as increasing renewable energy integration, stringent environmental regulations, and the need for improved grid resilience. Strategic partnerships, technological advancements, and government initiatives will continue to play a crucial role in shaping the future of this dynamic market. Opportunities exist for companies to innovate and expand their market share through strategic investments in research and development, expansion into new geographic markets, and the development of innovative business models.
Smart Grid Networking Industry Segmentation
-
1. Technology Application Area
- 1.1. Transmission
- 1.2. Demand Response
- 1.3. Advanced Metering Infrastructure (AMI)
- 1.4. Other Technology Application Areas
Smart Grid Networking Industry Segmentation By Geography
- 1. North America
- 2. Europe
- 3. Asia Pacific
- 4. South America
- 5. Middle East
Smart Grid Networking Industry REPORT HIGHLIGHTS
| Aspects | Details |
|---|---|
| Study Period | 2019-2033 |
| Base Year | 2024 |
| Estimated Year | 2025 |
| Forecast Period | 2025-2033 |
| Historical Period | 2019-2024 |
| Growth Rate | CAGR of > 11.00% from 2019-2033 |
| Segmentation |
|
Table of Contents
- 1. Introduction
- 1.1. Research Scope
- 1.2. Market Segmentation
- 1.3. Research Methodology
- 1.4. Definitions and Assumptions
- 2. Executive Summary
- 2.1. Introduction
- 3. Market Dynamics
- 3.1. Introduction
- 3.2. Market Drivers
- 3.2.1. 4.; Growing Power Demand from the Commercial and Industrial Sectors
- 3.3. Market Restrains
- 3.3.1. 4.; Stringent Environmental and Safety Regulations
- 3.4. Market Trends
- 3.4.1. Advanced Metering Infrastructure (AMI) to Witness Significant Growth
- 4. Market Factor Analysis
- 4.1. Porters Five Forces
- 4.2. Supply/Value Chain
- 4.3. PESTEL analysis
- 4.4. Market Entropy
- 4.5. Patent/Trademark Analysis
- 5. Global Smart Grid Networking Industry Analysis, Insights and Forecast, 2019-2031
- 5.1. Market Analysis, Insights and Forecast - by Technology Application Area
- 5.1.1. Transmission
- 5.1.2. Demand Response
- 5.1.3. Advanced Metering Infrastructure (AMI)
- 5.1.4. Other Technology Application Areas
- 5.2. Market Analysis, Insights and Forecast - by Region
- 5.2.1. North America
- 5.2.2. Europe
- 5.2.3. Asia Pacific
- 5.2.4. South America
- 5.2.5. Middle East
- 5.1. Market Analysis, Insights and Forecast - by Technology Application Area
- 6. North America Smart Grid Networking Industry Analysis, Insights and Forecast, 2019-2031
- 6.1. Market Analysis, Insights and Forecast - by Technology Application Area
- 6.1.1. Transmission
- 6.1.2. Demand Response
- 6.1.3. Advanced Metering Infrastructure (AMI)
- 6.1.4. Other Technology Application Areas
- 6.1. Market Analysis, Insights and Forecast - by Technology Application Area
- 7. Europe Smart Grid Networking Industry Analysis, Insights and Forecast, 2019-2031
- 7.1. Market Analysis, Insights and Forecast - by Technology Application Area
- 7.1.1. Transmission
- 7.1.2. Demand Response
- 7.1.3. Advanced Metering Infrastructure (AMI)
- 7.1.4. Other Technology Application Areas
- 7.1. Market Analysis, Insights and Forecast - by Technology Application Area
- 8. Asia Pacific Smart Grid Networking Industry Analysis, Insights and Forecast, 2019-2031
- 8.1. Market Analysis, Insights and Forecast - by Technology Application Area
- 8.1.1. Transmission
- 8.1.2. Demand Response
- 8.1.3. Advanced Metering Infrastructure (AMI)
- 8.1.4. Other Technology Application Areas
- 8.1. Market Analysis, Insights and Forecast - by Technology Application Area
- 9. South America Smart Grid Networking Industry Analysis, Insights and Forecast, 2019-2031
- 9.1. Market Analysis, Insights and Forecast - by Technology Application Area
- 9.1.1. Transmission
- 9.1.2. Demand Response
- 9.1.3. Advanced Metering Infrastructure (AMI)
- 9.1.4. Other Technology Application Areas
- 9.1. Market Analysis, Insights and Forecast - by Technology Application Area
- 10. Middle East Smart Grid Networking Industry Analysis, Insights and Forecast, 2019-2031
- 10.1. Market Analysis, Insights and Forecast - by Technology Application Area
- 10.1.1. Transmission
- 10.1.2. Demand Response
- 10.1.3. Advanced Metering Infrastructure (AMI)
- 10.1.4. Other Technology Application Areas
- 10.1. Market Analysis, Insights and Forecast - by Technology Application Area
- 11. North America Smart Grid Networking Industry Analysis, Insights and Forecast, 2019-2031
- 11.1. Market Analysis, Insights and Forecast - By Country/Sub-region
- 11.1.1 United States
- 11.1.2 Canada
- 11.1.3 Mexico
- 12. Europe Smart Grid Networking Industry Analysis, Insights and Forecast, 2019-2031
- 12.1. Market Analysis, Insights and Forecast - By Country/Sub-region
- 12.1.1 Germany
- 12.1.2 United Kingdom
- 12.1.3 France
- 12.1.4 Spain
- 12.1.5 Italy
- 12.1.6 Spain
- 12.1.7 Belgium
- 12.1.8 Netherland
- 12.1.9 Nordics
- 12.1.10 Rest of Europe
- 13. Asia Pacific Smart Grid Networking Industry Analysis, Insights and Forecast, 2019-2031
- 13.1. Market Analysis, Insights and Forecast - By Country/Sub-region
- 13.1.1 China
- 13.1.2 Japan
- 13.1.3 India
- 13.1.4 South Korea
- 13.1.5 Southeast Asia
- 13.1.6 Australia
- 13.1.7 Indonesia
- 13.1.8 Phillipes
- 13.1.9 Singapore
- 13.1.10 Thailandc
- 13.1.11 Rest of Asia Pacific
- 14. South America Smart Grid Networking Industry Analysis, Insights and Forecast, 2019-2031
- 14.1. Market Analysis, Insights and Forecast - By Country/Sub-region
- 14.1.1 Brazil
- 14.1.2 Argentina
- 14.1.3 Peru
- 14.1.4 Chile
- 14.1.5 Colombia
- 14.1.6 Ecuador
- 14.1.7 Venezuela
- 14.1.8 Rest of South America
- 15. North America Smart Grid Networking Industry Analysis, Insights and Forecast, 2019-2031
- 15.1. Market Analysis, Insights and Forecast - By Country/Sub-region
- 15.1.1 United States
- 15.1.2 Canada
- 15.1.3 Mexico
- 16. MEA Smart Grid Networking Industry Analysis, Insights and Forecast, 2019-2031
- 16.1. Market Analysis, Insights and Forecast - By Country/Sub-region
- 16.1.1 United Arab Emirates
- 16.1.2 Saudi Arabia
- 16.1.3 South Africa
- 16.1.4 Rest of Middle East and Africa
- 17. Competitive Analysis
- 17.1. Global Market Share Analysis 2024
- 17.2. Company Profiles
- 17.2.1 Itron Inc
- 17.2.1.1. Overview
- 17.2.1.2. Products
- 17.2.1.3. SWOT Analysis
- 17.2.1.4. Recent Developments
- 17.2.1.5. Financials (Based on Availability)
- 17.2.2 ABB Ltd
- 17.2.2.1. Overview
- 17.2.2.2. Products
- 17.2.2.3. SWOT Analysis
- 17.2.2.4. Recent Developments
- 17.2.2.5. Financials (Based on Availability)
- 17.2.3 Hitachi Ltd
- 17.2.3.1. Overview
- 17.2.3.2. Products
- 17.2.3.3. SWOT Analysis
- 17.2.3.4. Recent Developments
- 17.2.3.5. Financials (Based on Availability)
- 17.2.4 Cisco Systems Inc
- 17.2.4.1. Overview
- 17.2.4.2. Products
- 17.2.4.3. SWOT Analysis
- 17.2.4.4. Recent Developments
- 17.2.4.5. Financials (Based on Availability)
- 17.2.5 Siemens AG
- 17.2.5.1. Overview
- 17.2.5.2. Products
- 17.2.5.3. SWOT Analysis
- 17.2.5.4. Recent Developments
- 17.2.5.5. Financials (Based on Availability)
- 17.2.6 Schneider Electric SE
- 17.2.6.1. Overview
- 17.2.6.2. Products
- 17.2.6.3. SWOT Analysis
- 17.2.6.4. Recent Developments
- 17.2.6.5. Financials (Based on Availability)
- 17.2.7 Eaton Corporation PLC
- 17.2.7.1. Overview
- 17.2.7.2. Products
- 17.2.7.3. SWOT Analysis
- 17.2.7.4. Recent Developments
- 17.2.7.5. Financials (Based on Availability)
- 17.2.8 General Electric Company
- 17.2.8.1. Overview
- 17.2.8.2. Products
- 17.2.8.3. SWOT Analysis
- 17.2.8.4. Recent Developments
- 17.2.8.5. Financials (Based on Availability)
- 17.2.9 Honeywell International Inc *List Not Exhaustive
- 17.2.9.1. Overview
- 17.2.9.2. Products
- 17.2.9.3. SWOT Analysis
- 17.2.9.4. Recent Developments
- 17.2.9.5. Financials (Based on Availability)
- 17.2.10 Osaki Electric Co Ltd
- 17.2.10.1. Overview
- 17.2.10.2. Products
- 17.2.10.3. SWOT Analysis
- 17.2.10.4. Recent Developments
- 17.2.10.5. Financials (Based on Availability)
- 17.2.1 Itron Inc
List of Figures
- Figure 1: Global Smart Grid Networking Industry Revenue Breakdown (Million, %) by Region 2024 & 2032
- Figure 2: North America Smart Grid Networking Industry Revenue (Million), by Country 2024 & 2032
- Figure 3: North America Smart Grid Networking Industry Revenue Share (%), by Country 2024 & 2032
- Figure 4: Europe Smart Grid Networking Industry Revenue (Million), by Country 2024 & 2032
- Figure 5: Europe Smart Grid Networking Industry Revenue Share (%), by Country 2024 & 2032
- Figure 6: Asia Pacific Smart Grid Networking Industry Revenue (Million), by Country 2024 & 2032
- Figure 7: Asia Pacific Smart Grid Networking Industry Revenue Share (%), by Country 2024 & 2032
- Figure 8: South America Smart Grid Networking Industry Revenue (Million), by Country 2024 & 2032
- Figure 9: South America Smart Grid Networking Industry Revenue Share (%), by Country 2024 & 2032
- Figure 10: North America Smart Grid Networking Industry Revenue (Million), by Country 2024 & 2032
- Figure 11: North America Smart Grid Networking Industry Revenue Share (%), by Country 2024 & 2032
- Figure 12: MEA Smart Grid Networking Industry Revenue (Million), by Country 2024 & 2032
- Figure 13: MEA Smart Grid Networking Industry Revenue Share (%), by Country 2024 & 2032
- Figure 14: North America Smart Grid Networking Industry Revenue (Million), by Technology Application Area 2024 & 2032
- Figure 15: North America Smart Grid Networking Industry Revenue Share (%), by Technology Application Area 2024 & 2032
- Figure 16: North America Smart Grid Networking Industry Revenue (Million), by Country 2024 & 2032
- Figure 17: North America Smart Grid Networking Industry Revenue Share (%), by Country 2024 & 2032
- Figure 18: Europe Smart Grid Networking Industry Revenue (Million), by Technology Application Area 2024 & 2032
- Figure 19: Europe Smart Grid Networking Industry Revenue Share (%), by Technology Application Area 2024 & 2032
- Figure 20: Europe Smart Grid Networking Industry Revenue (Million), by Country 2024 & 2032
- Figure 21: Europe Smart Grid Networking Industry Revenue Share (%), by Country 2024 & 2032
- Figure 22: Asia Pacific Smart Grid Networking Industry Revenue (Million), by Technology Application Area 2024 & 2032
- Figure 23: Asia Pacific Smart Grid Networking Industry Revenue Share (%), by Technology Application Area 2024 & 2032
- Figure 24: Asia Pacific Smart Grid Networking Industry Revenue (Million), by Country 2024 & 2032
- Figure 25: Asia Pacific Smart Grid Networking Industry Revenue Share (%), by Country 2024 & 2032
- Figure 26: South America Smart Grid Networking Industry Revenue (Million), by Technology Application Area 2024 & 2032
- Figure 27: South America Smart Grid Networking Industry Revenue Share (%), by Technology Application Area 2024 & 2032
- Figure 28: South America Smart Grid Networking Industry Revenue (Million), by Country 2024 & 2032
- Figure 29: South America Smart Grid Networking Industry Revenue Share (%), by Country 2024 & 2032
- Figure 30: Middle East Smart Grid Networking Industry Revenue (Million), by Technology Application Area 2024 & 2032
- Figure 31: Middle East Smart Grid Networking Industry Revenue Share (%), by Technology Application Area 2024 & 2032
- Figure 32: Middle East Smart Grid Networking Industry Revenue (Million), by Country 2024 & 2032
- Figure 33: Middle East Smart Grid Networking Industry Revenue Share (%), by Country 2024 & 2032
List of Tables
- Table 1: Global Smart Grid Networking Industry Revenue Million Forecast, by Region 2019 & 2032
- Table 2: Global Smart Grid Networking Industry Revenue Million Forecast, by Technology Application Area 2019 & 2032
- Table 3: Global Smart Grid Networking Industry Revenue Million Forecast, by Region 2019 & 2032
- Table 4: Global Smart Grid Networking Industry Revenue Million Forecast, by Country 2019 & 2032
- Table 5: United States Smart Grid Networking Industry Revenue (Million) Forecast, by Application 2019 & 2032
- Table 6: Canada Smart Grid Networking Industry Revenue (Million) Forecast, by Application 2019 & 2032
- Table 7: Mexico Smart Grid Networking Industry Revenue (Million) Forecast, by Application 2019 & 2032
- Table 8: Global Smart Grid Networking Industry Revenue Million Forecast, by Country 2019 & 2032
- Table 9: Germany Smart Grid Networking Industry Revenue (Million) Forecast, by Application 2019 & 2032
- Table 10: United Kingdom Smart Grid Networking Industry Revenue (Million) Forecast, by Application 2019 & 2032
- Table 11: France Smart Grid Networking Industry Revenue (Million) Forecast, by Application 2019 & 2032
- Table 12: Spain Smart Grid Networking Industry Revenue (Million) Forecast, by Application 2019 & 2032
- Table 13: Italy Smart Grid Networking Industry Revenue (Million) Forecast, by Application 2019 & 2032
- Table 14: Spain Smart Grid Networking Industry Revenue (Million) Forecast, by Application 2019 & 2032
- Table 15: Belgium Smart Grid Networking Industry Revenue (Million) Forecast, by Application 2019 & 2032
- Table 16: Netherland Smart Grid Networking Industry Revenue (Million) Forecast, by Application 2019 & 2032
- Table 17: Nordics Smart Grid Networking Industry Revenue (Million) Forecast, by Application 2019 & 2032
- Table 18: Rest of Europe Smart Grid Networking Industry Revenue (Million) Forecast, by Application 2019 & 2032
- Table 19: Global Smart Grid Networking Industry Revenue Million Forecast, by Country 2019 & 2032
- Table 20: China Smart Grid Networking Industry Revenue (Million) Forecast, by Application 2019 & 2032
- Table 21: Japan Smart Grid Networking Industry Revenue (Million) Forecast, by Application 2019 & 2032
- Table 22: India Smart Grid Networking Industry Revenue (Million) Forecast, by Application 2019 & 2032
- Table 23: South Korea Smart Grid Networking Industry Revenue (Million) Forecast, by Application 2019 & 2032
- Table 24: Southeast Asia Smart Grid Networking Industry Revenue (Million) Forecast, by Application 2019 & 2032
- Table 25: Australia Smart Grid Networking Industry Revenue (Million) Forecast, by Application 2019 & 2032
- Table 26: Indonesia Smart Grid Networking Industry Revenue (Million) Forecast, by Application 2019 & 2032
- Table 27: Phillipes Smart Grid Networking Industry Revenue (Million) Forecast, by Application 2019 & 2032
- Table 28: Singapore Smart Grid Networking Industry Revenue (Million) Forecast, by Application 2019 & 2032
- Table 29: Thailandc Smart Grid Networking Industry Revenue (Million) Forecast, by Application 2019 & 2032
- Table 30: Rest of Asia Pacific Smart Grid Networking Industry Revenue (Million) Forecast, by Application 2019 & 2032
- Table 31: Global Smart Grid Networking Industry Revenue Million Forecast, by Country 2019 & 2032
- Table 32: Brazil Smart Grid Networking Industry Revenue (Million) Forecast, by Application 2019 & 2032
- Table 33: Argentina Smart Grid Networking Industry Revenue (Million) Forecast, by Application 2019 & 2032
- Table 34: Peru Smart Grid Networking Industry Revenue (Million) Forecast, by Application 2019 & 2032
- Table 35: Chile Smart Grid Networking Industry Revenue (Million) Forecast, by Application 2019 & 2032
- Table 36: Colombia Smart Grid Networking Industry Revenue (Million) Forecast, by Application 2019 & 2032
- Table 37: Ecuador Smart Grid Networking Industry Revenue (Million) Forecast, by Application 2019 & 2032
- Table 38: Venezuela Smart Grid Networking Industry Revenue (Million) Forecast, by Application 2019 & 2032
- Table 39: Rest of South America Smart Grid Networking Industry Revenue (Million) Forecast, by Application 2019 & 2032
- Table 40: Global Smart Grid Networking Industry Revenue Million Forecast, by Country 2019 & 2032
- Table 41: United States Smart Grid Networking Industry Revenue (Million) Forecast, by Application 2019 & 2032
- Table 42: Canada Smart Grid Networking Industry Revenue (Million) Forecast, by Application 2019 & 2032
- Table 43: Mexico Smart Grid Networking Industry Revenue (Million) Forecast, by Application 2019 & 2032
- Table 44: Global Smart Grid Networking Industry Revenue Million Forecast, by Country 2019 & 2032
- Table 45: United Arab Emirates Smart Grid Networking Industry Revenue (Million) Forecast, by Application 2019 & 2032
- Table 46: Saudi Arabia Smart Grid Networking Industry Revenue (Million) Forecast, by Application 2019 & 2032
- Table 47: South Africa Smart Grid Networking Industry Revenue (Million) Forecast, by Application 2019 & 2032
- Table 48: Rest of Middle East and Africa Smart Grid Networking Industry Revenue (Million) Forecast, by Application 2019 & 2032
- Table 49: Global Smart Grid Networking Industry Revenue Million Forecast, by Technology Application Area 2019 & 2032
- Table 50: Global Smart Grid Networking Industry Revenue Million Forecast, by Country 2019 & 2032
- Table 51: Global Smart Grid Networking Industry Revenue Million Forecast, by Technology Application Area 2019 & 2032
- Table 52: Global Smart Grid Networking Industry Revenue Million Forecast, by Country 2019 & 2032
- Table 53: Global Smart Grid Networking Industry Revenue Million Forecast, by Technology Application Area 2019 & 2032
- Table 54: Global Smart Grid Networking Industry Revenue Million Forecast, by Country 2019 & 2032
- Table 55: Global Smart Grid Networking Industry Revenue Million Forecast, by Technology Application Area 2019 & 2032
- Table 56: Global Smart Grid Networking Industry Revenue Million Forecast, by Country 2019 & 2032
- Table 57: Global Smart Grid Networking Industry Revenue Million Forecast, by Technology Application Area 2019 & 2032
- Table 58: Global Smart Grid Networking Industry Revenue Million Forecast, by Country 2019 & 2032
Frequently Asked Questions
1. What is the projected Compound Annual Growth Rate (CAGR) of the Smart Grid Networking Industry?
The projected CAGR is approximately > 11.00%.
2. Which companies are prominent players in the Smart Grid Networking Industry?
Key companies in the market include Itron Inc, ABB Ltd, Hitachi Ltd, Cisco Systems Inc, Siemens AG, Schneider Electric SE, Eaton Corporation PLC, General Electric Company, Honeywell International Inc *List Not Exhaustive, Osaki Electric Co Ltd.
3. What are the main segments of the Smart Grid Networking Industry?
The market segments include Technology Application Area.
4. Can you provide details about the market size?
The market size is estimated to be USD XX Million as of 2022.
5. What are some drivers contributing to market growth?
4.; Growing Power Demand from the Commercial and Industrial Sectors.
6. What are the notable trends driving market growth?
Advanced Metering Infrastructure (AMI) to Witness Significant Growth.
7. Are there any restraints impacting market growth?
4.; Stringent Environmental and Safety Regulations.
8. Can you provide examples of recent developments in the market?
In January 2021, Schneider Electric acquired DC Systems BV, a major supplier of smart systems. This acquisition has helped Schneider Electric advance innovations in the electrical distribution and smart grid sectors.
9. What pricing options are available for accessing the report?
Pricing options include single-user, multi-user, and enterprise licenses priced at USD 4750, USD 5250, and USD 8750 respectively.
10. Is the market size provided in terms of value or volume?
The market size is provided in terms of value, measured in Million.
11. Are there any specific market keywords associated with the report?
Yes, the market keyword associated with the report is "Smart Grid Networking Industry," which aids in identifying and referencing the specific market segment covered.
12. How do I determine which pricing option suits my needs best?
The pricing options vary based on user requirements and access needs. Individual users may opt for single-user licenses, while businesses requiring broader access may choose multi-user or enterprise licenses for cost-effective access to the report.
13. Are there any additional resources or data provided in the Smart Grid Networking Industry report?
While the report offers comprehensive insights, it's advisable to review the specific contents or supplementary materials provided to ascertain if additional resources or data are available.
14. How can I stay updated on further developments or reports in the Smart Grid Networking Industry?
To stay informed about further developments, trends, and reports in the Smart Grid Networking Industry, consider subscribing to industry newsletters, following relevant companies and organizations, or regularly checking reputable industry news sources and publications.
Methodology
Step 1 - Identification of Relevant Samples Size from Population Database


Step 2 - Approaches for Defining Global Market Size (Value, Volume* & Price*)

Note*: In applicable scenarios
Step 3 - Data Sources
Primary Research
- Web Analytics
- Survey Reports
- Research Institute
- Latest Research Reports
- Opinion Leaders
Secondary Research
- Annual Reports
- White Paper
- Latest Press Release
- Industry Association
- Paid Database
- Investor Presentations

Step 4 - Data Triangulation
Involves using different sources of information in order to increase the validity of a study
These sources are likely to be stakeholders in a program - participants, other researchers, program staff, other community members, and so on.
Then we put all data in single framework & apply various statistical tools to find out the dynamic on the market.
During the analysis stage, feedback from the stakeholder groups would be compared to determine areas of agreement as well as areas of divergence
